larashero3-dotcom/lieflat-charts
An art director for AI agents that hate ugly charts
A skill package that turns AI agents into editorial data-visualization designers.
Feature · 04 Sep 2026
A Visual Grammar for Agents Tired of Defaulting to Chart.js
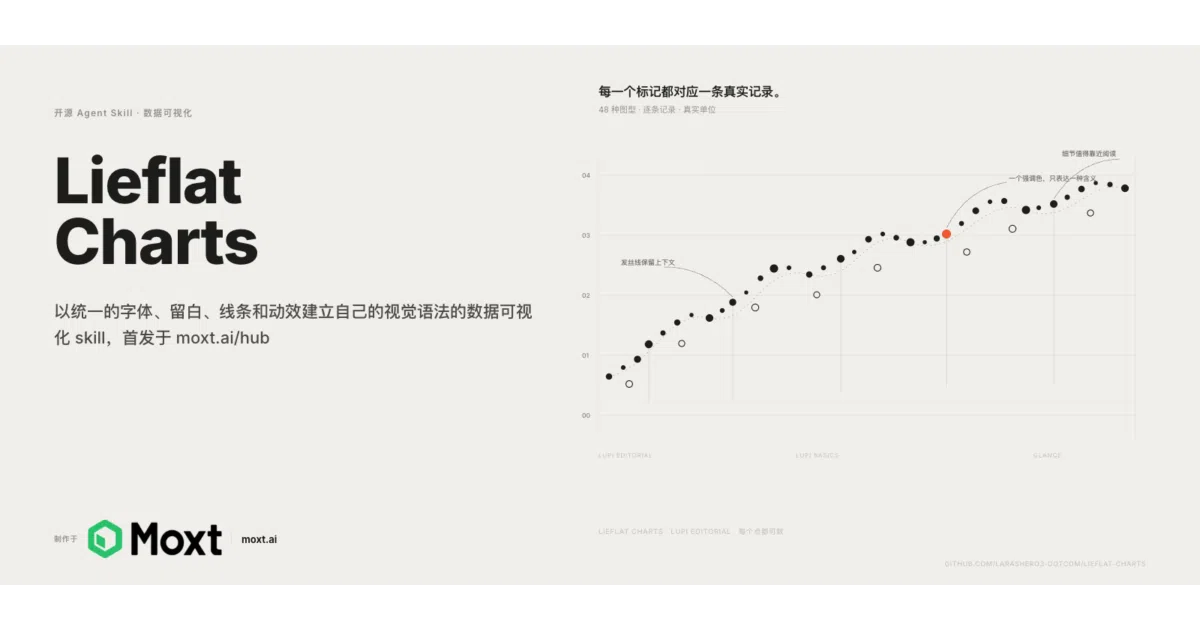
Lieflat Charts packages an editorial design system into an AI skill, turning agent-generated dataviz from generic code into structured visual narratives.
Read the in-depth article →
Velocity · 7d
+18
★ / day
Trend
↘cooling
star history
What it does
Lieflat Charts is a skill package for AI agents that speak the SKILL.md format—moxt, Claude Code, and Codex included. Hand it data and it returns interactive HTML charts, or full-page bilingual reports if you explicitly ask for them. The output is standalone HTML with editorial typography, motion, and structured whitespace rather than generic widget-like plots.
The interesting bit
Instead of a one-size-fits-all template, the skill auto-selects between three visual personalities—Lupi for slow narrative reading, Glance for instant dashboard scanning, and Basics for familiar chart shapes with refined detail—and picks a color system based on data structure. It essentially gives the agent a magazine art director’s taste without human micro-management.
Key highlights
- Three visual grammars: Lupi (editorial narrative), Glance (rapid judgment), and Basics (refined standard charts).
- Auto-selected color palettes: Mono fallback, plus Porcelain Blue, Palm Green, and Editorial Red; custom brand colors supported if specified.
- Twelve full-page HTML report templates in both Chinese and English, covering annual reviews, dashboards, posters, and research briefs.
- Interactive templates for networks, path data, and multi-segment flows.
- Native integration with moxt.ai, where the skill was designed and validated.
Caveats
- The README notes the smoothest experience is inside moxt.ai; other agents may need more context to reach the same output quality.
- It targets agent environments, not human developers looking for a drop-in charting library.
Verdict
Worth a look if you want your agent’s data stories to look like a designed publication rather than a spreadsheet export. Skip it if you need a programmable charting library for a human-coded frontend.
Frequently asked
- What is larashero3-dotcom/lieflat-charts?
- A skill package that turns AI agents into editorial data-visualization designers.
- Is lieflat-charts open source?
- Yes — larashero3-dotcom/lieflat-charts is an open-source project tracked on heatdrop.
- What language is lieflat-charts written in?
- larashero3-dotcom/lieflat-charts is primarily written in HTML.
- How popular is lieflat-charts?
- larashero3-dotcom/lieflat-charts has 6k stars on GitHub and is currently cooling off.
- Where can I find lieflat-charts?
- larashero3-dotcom/lieflat-charts is on GitHub at https://github.com/larashero3-dotcom/lieflat-charts.