larashero3-dotcom/lieflat-charts · 04 Sep 2026 · Feature
A Visual Grammar for Agents Tired of Defaulting to Chart.js

Tomás Almeida
Editor
Lieflat Charts packages an editorial design system into an AI skill, turning agent-generated dataviz from generic code into structured visual narratives.
larashero3-dotcom/lieflat-charts
★6.4k stars Velocity · 7d +27 ★/day ↗accelerating
star history
The Default Library Trap
AI coding agents can generate charts almost as fast as they can hallucinate axis labels, but their taste is derivative. According to an analysis by LightningChart JS, agents including Claude Code, Cursor, and Copilot select JavaScript charting libraries based on frequency in public training data rather than fitness for purpose. Simple request? Chart.js. React mentioned? Recharts. Anything custom? D3.js. The result is a landscape of technically competent but visually undifferentiated output that satisfies the prompt without making a design decision.
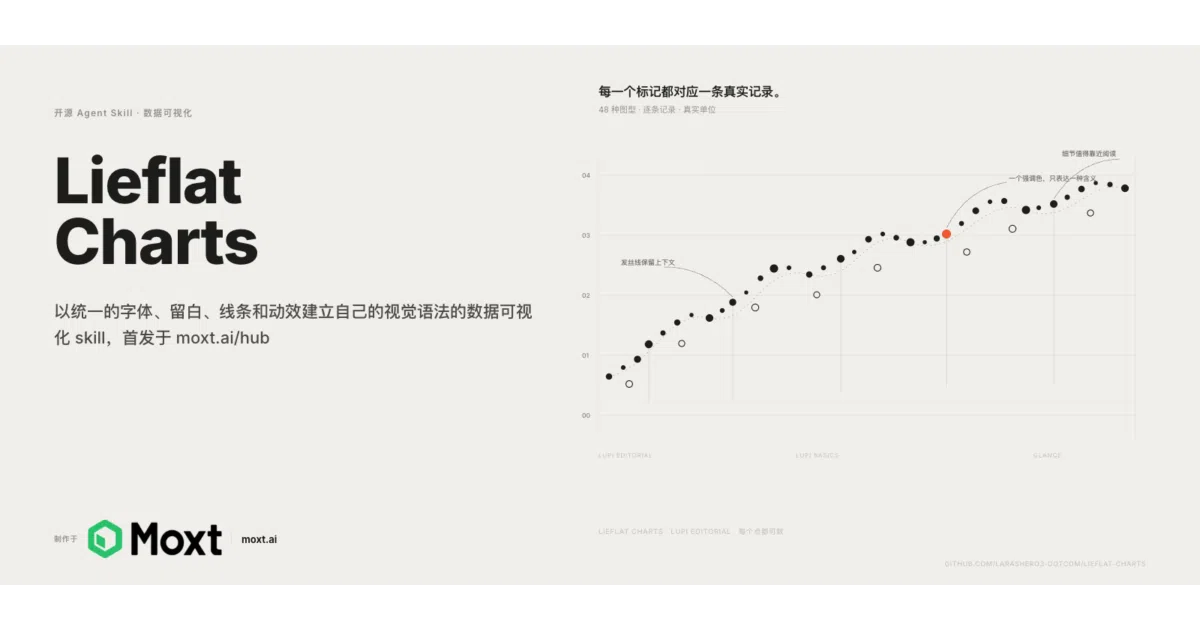
This frequency-based defaulting creates a hidden cost. Users must iteratively steer the agent toward something usable, describing visual goals through trial and error, as noted in GitHub Community discussions of text-to-chart workflows. Lieflat Charts enters this environment not as another library, but as an intervention. It is a data visualization and report-generation skill built for the emerging Agent Skills format—a reusable package of instructions and files, typically anchored by a SKILL.md, that loads design rules into the agent’s context only when needed. Instead of asking an agent to improvise a chart from its training data, the user loads a visual grammar and asks the agent to execute it.
Reading Speed as a Technical Primitive
The central insight of Lieflat Charts is that a chart is not merely a mapped dataset; it is a controlled reading experience. The project organizes its forty-nine templates into three dialects—Lupi Editorial, Glance, and Basics—each tuned to a distinct cognitive tempo.
Lupi Editorial assumes the reader will linger. It deploys hairlines, dot matrices, ledger-style rails, and generous whitespace to present individual records without premature aggregation. Titles, source lines, and marginalia participate in the expression. This is the dialect of annual reports, academic papers, and long-form data stories. Glance operates at the opposite pole. It thickens bars, inflates key figures, and sorts conclusions to the top so a dashboard reader can absorb hierarchy in seconds. Basics occupies the middle, retaining familiar silhouettes—bars, lines, rings, treemaps—while imposing countable units and editorial typography so that even a simple column retains density and proportion.
The skill does not treat these categories as cosmetic skins. It instructs the agent to select a dialect based on the user’s intent and the data’s narrative load, not merely on the raw shape of the dataset. A weekly operations brief defaults to Glance; a product almanac spanning eight years defaults to Lupi. The system also recognizes deliverable semantics. Unless the user explicitly requests a white paper, annual report, poster, or brief, the agent stays in chart mode. When report mode triggers, it assembles one of twelve bilingual full-page HTML templates—covering research releases, competitor dashboards, travel logs, and milestone timelines—populating them with charts chosen from the catalog. The result is a single-file, double-clickable HTML document that requires no build step, though some templates pull Chart.js or ECharts from a CDN.
Color as Data Semantics
Where most agent-generated visualization treats color as an aesthetic afterthought, Lieflat Charts encodes it as a semantic signal. The default state is Mono: a grayscale system of paper gray, charcoal, and intermediate steps where luminance carries hierarchy and spatial position carries meaning. When the data demands distinction, the skill selects from three presets based on structural logic rather than user whim.
Porcelain, a single-hue blue luminance scale, is reserved for ordered data and single sequences. Palm, a low-saturation green-yellow system, distinguishes small numbers of unordered categories. Wire, a grayscale field punctuated by one fluorescent orange focal point, directs attention to a specific locus. If the data structure is ambiguous, the system falls back to Mono. A user-supplied brand color can override the palette, but the skill enforces a strict rule: one delivery, one color system, with contrast and visual hierarchy preserved.
This discipline directly addresses a common failure mode in agent-generated graphics, where an unguided model might splash a categorical rainbow across ordinal data or mix color systems within a single report. The shared token files—monochrome scales and color presets—function as a stylesheet the agent consults before rendering, effectively giving the model a restrained and consistent eye.
The Anatomy of a Skill
It is worth stating plainly what Lieflat Charts is not. It is not a novel rendering engine. The Lupi and Basics templates rely largely on hand-written SVG; treemaps, force graphs, and certain Glance outputs delegate to ECharts or Chart.js. Its value lies in the arrangement and the constraints, not in the drawing primitives.
The repository is essentially a design system packaged as a filesystem: a SKILL.md workflow file, a catalog.md indexing the data contracts of forty-nine chart types, a report-catalog.md for twelve full-page report templates, shared JavaScript token files for color and typography, and a gallery of examples. The agent reads the catalog, judges the data contract, selects a template, and renders. For non-programmers, this collapses the distance between a dataset and a publication-ready graphic. For developers, it offers something rarer: a structured editorial layer that prevents the agent from defaulting to the most common library in its training set.
The project carries a PolyForm Noncommercial License, which permits learning, modification, and non-commercial use while requiring separate permission for commercial deployment. This is a significant boundary for a tool that otherwise presents itself as production-ready.
Adoption and the Workspace Model
Lieflat Charts was built at moxt.ai, a platform that hosts and refines agent skills, and the documentation is candid about where it performs best. In a persistent workspace, the agent retains the design rules, templates, data, and rendered HTML across turns, allowing multi-round refinement without re-establishing context. The comparison to conventional one-shot prompting is stark: instead of re-uploading files and re-describing background each time, the agent continues within a shared environment.
The traction is modest but telling. According to its SkillsLLM listing, the repository holds nearly four thousand stars and over two hundred forks. That places it in a niche category—not a mass-market framework, but a specialized instrument for a specific workflow. The time savings can be substantial. A separate skill-based workflow documented in Towards Data Science compressed a one-hour manual visualization process into under ten minutes of agent-assisted work. Lieflat Charts aims for a similar compression across an entire editorial pipeline, from chart selection to final report assembly.
Limits and Rough Edges
The skill is only as disciplined as the agent reading it. The catalog.md and report-catalog.md files are meant to constrain template selection, but if the agent misjudges the data structure—treating an ordered time series as unordered categories, for instance—it will apply the wrong visual grammar. The color-selection heuristics, while logical, depend on the agent’s interpretation of “ordered” versus “unordered,” a distinction that can blur with messy real-world data.
There are technical limitations, too. While the project advertises single-file HTML output, some templates require network access for fonts, Chart.js, or ECharts, meaning the offline promise is not absolute. And the Agent Skills format itself remains emergent; there is no standards body for SKILL.md, only conventions shared across Claude Code, Codex, and a growing ecosystem of platforms. The skill is portable, but its native habitat is moxt.ai, and its full workflow assumes a workspace persistence that not all agent environments provide.
From Vibe Coding to Visual Grammar
Lieflat Charts arrives at a transition point. Much current discourse around AI and visualization centers on “vibe coding”: describing a chart in natural language and hoping the agent generates something playable, then iterating through trial and error. The results are often functional but visually incoherent, bound by the default libraries that dominate training corpora.
Lieflat Charts proposes an alternative: encode the terminology, the decisions, and the constraints into a reusable skill. The agent is no longer improvising with Chart.js; it is executing a design system that understands reading speed, data semantics, and deliverable context. Whether this approach scales beyond the noncommercial niche, and whether the SKILL.md format solidifies into a true standard or fragments across competing platforms, remains unresolved. For now, the project offers a compelling argument that agent-generated data visualization can have an editorial voice—provided someone has already done the hard work of teaching it grammar.
Sources
- AI and the Future of Data Visualization
- Generate Visualizations and Graphs with Your AI Agent
- Beyond Prompting: Using Agent Skills in Data Science
- Tools for Creating Animated Interactive Charts with AI ... - GitHub
- LieFlat - Find the Best Lie-Flat Business Class Seats
- Generative AI for visualization: State of the art and future ...
- I Tried Vibe-Coding a Data Visualization App - YouTube
- lieflat-charts - AI Agents on GitHub (1.9k★) | SkillsLLM
- Beyond Prompting: Using Agent Skills in Data Science
- Which JavaScript Chart Library Do AI Coding Agents Actually ...
- Which do you think is the better layout for lie-flat ...
- AI Agents Market Size, Share And Trends Report, 2026-2033