microsoft/flint-chart
A chart compiler that stops AI agents from guessing at layout
Flint compiles compact, human-editable chart specs into polished Vega-Lite, ECharts, or Chart.js visualizations so agents and developers can skip hand-tuning scales, axes, and spacing.
Feature · 09 Aug 2026
Microsoft's Bet on an Intermediate Language for AI Charts
Flint is a visualization compiler that lets AI agents write compact, semantic chart specs while it handles the fragile low-level details of multiple rendering backends.
Read the in-depth article →
Velocity · 7d
+3.6
★ / day
Trend
↘cooling
star history
What it does
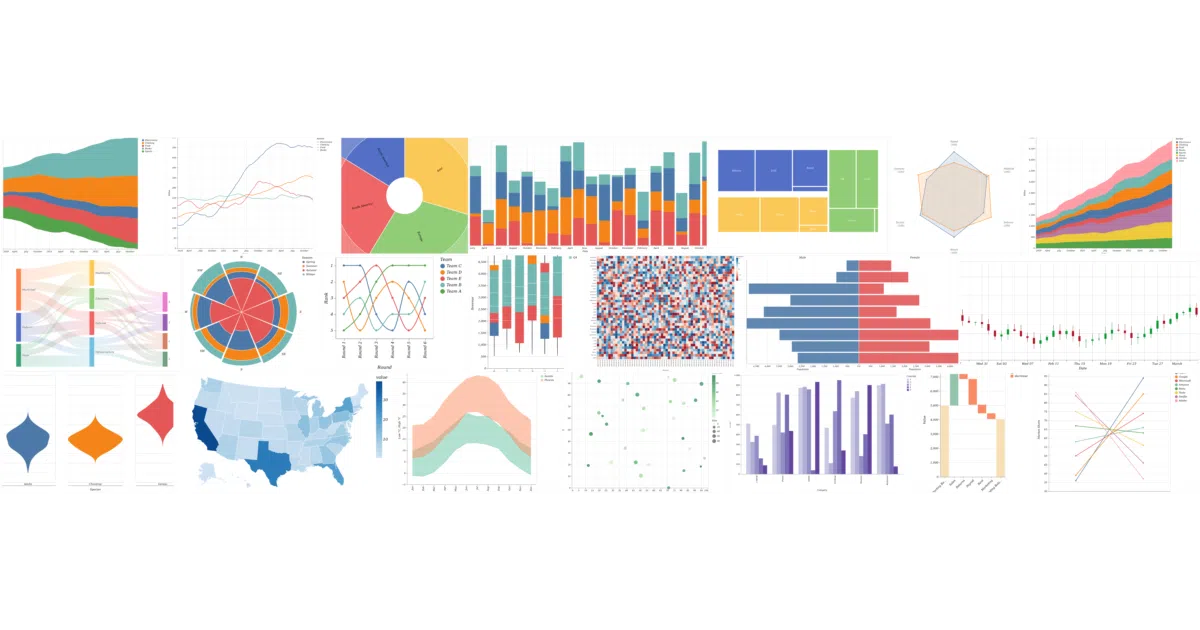
Flint is a visualization intermediate language that turns a compact chart specification into a fully realized, backend-native spec. You declare fields and semantic types—such as Quantity or Country—and the compiler derives the layout, scales, axes, labels, and legends automatically. The same input feeds a TypeScript library and an MCP server, so both humans and agents can author charts without touching the verbose JSON of the underlying renderers.
The interesting bit
Rather than treating chart configuration as a direct mapping exercise, Flint frames it as a compilation problem driven by data semantics. It recognizes 70-odd semantic types—Rank, Temperature, Price, etc.—and uses them to make layout decisions that would otherwise require a human to fiddle with pixel values across three different libraries.
Key highlights
- One spec compiles to 30+ chart types across Vega-Lite, ECharts, and Chart.js backends.
- 70+ semantic data types drive automatic layout, sizing, mark selection, and legend placement.
- Ships with an MCP server for agent workflows, plus a standalone agent skill for non-MCP environments.
- Human-editable specs mean you can revise the compact input after an agent produces it.
- A Python port exists as a source-only preview; the published packages are currently npm-only.
Caveats
- The Python package is unreleased; only a source-only preview is present in the repo.
- Additional rendering backends are promised but not yet available beyond the initial three.
- A research paper describing the architecture is listed as “coming soon.”
Verdict
Useful if you’re building agentic tools or internal dashboards and want LLMs to emit charts that don’t need a frontend engineer to clean up. Less compelling if your pipeline already relies on heavily hand-tuned, backend-specific configurations you don’t want an intermediate layer touching.
Frequently asked
- What is microsoft/flint-chart?
- Flint compiles compact, human-editable chart specs into polished Vega-Lite, ECharts, or Chart.js visualizations so agents and developers can skip hand-tuning scales, axes, and spacing.
- Is flint-chart open source?
- Yes — microsoft/flint-chart is open source, released under the MIT license.
- What language is flint-chart written in?
- microsoft/flint-chart is primarily written in TypeScript.
- How popular is flint-chart?
- microsoft/flint-chart has 4.3k stars on GitHub and is currently cooling off.
- Where can I find flint-chart?
- microsoft/flint-chart is on GitHub at https://github.com/microsoft/flint-chart.