datalogue/keras-attention
Attention maps that expose what your RNN actually learned
A Keras implementation that visualizes attention weights to debug why a date-translation model makes specific predictions.
Not currently ranked — collecting fresh signals.
star history
What it does
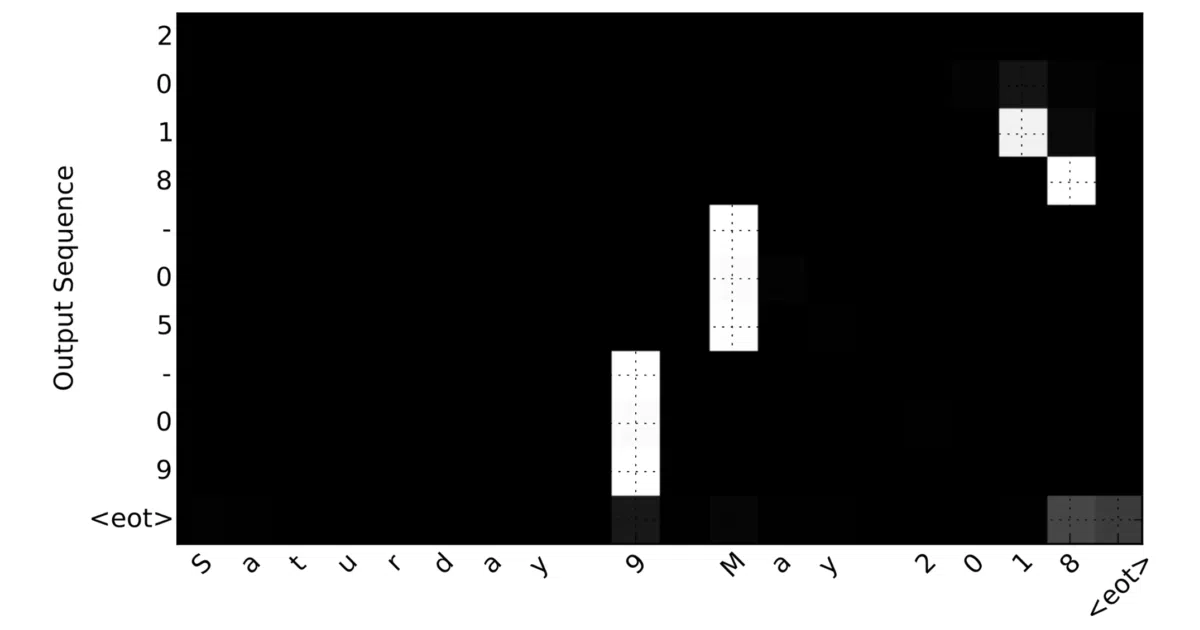
This repo implements a custom RNN layer with attention in Keras, trained on a toy problem: converting human-readable dates (“Saturday January 5 2016”) into machine formats (“2016-01-05”). The real product is the visualization script that plots attention weights as heatmaps, showing which input tokens the model considered relevant for each output token.
The interesting bit
The attention maps reveal concrete failure modes. One example shows the model correctly learning that “Saturday” carries no predictive value; another shows it hallucinating “02” from the “20” in “2016” when parsing a mangled input. It’s interpretability as bug report.
Key highlights
- Custom Keras attention layer with full training and visualization pipeline
- Generates synthetic date data with configurable vocabulary
- Pre-trained weights and example files included so you can run
visualize.pyimmediately - Accompanied by a Medium tutorial walking through the attention mechanism
- Python 3.4+, GPU strongly recommended (CPU training is “prohibitively slow”)
Caveats
- Status: “Reference code only. No updates expected” — the authors have explicitly abandoned maintenance
- Built for an older Keras/TensorFlow ecosystem; requirements files may need pinning to run today
- The
run.pyhelp text has a copy-paste error (“Location of validation data” appears twice, once for batch size)
Verdict
Worth a look if you’re teaching or learning attention mechanisms and want concrete visual intuition. Skip it if you need production-grade tooling — this is a 2017-era educational artifact, not a maintained library.
Frequently asked
- What is datalogue/keras-attention?
- A Keras implementation that visualizes attention weights to debug why a date-translation model makes specific predictions.
- Is keras-attention open source?
- Yes — datalogue/keras-attention is open source, released under the AGPL-3.0 license.
- What language is keras-attention written in?
- datalogue/keras-attention is primarily written in Python.
- How popular is keras-attention?
- datalogue/keras-attention has 749 stars on GitHub.
- Where can I find keras-attention?
- datalogue/keras-attention is on GitHub at https://github.com/datalogue/keras-attention.