AutoViML/AutoViz
Charts from CSVs without the matplotlib boilerplate
AutoViz eliminates the matplotlib boilerplate of exploratory data analysis by auto-generating charts from a file or dataframe in one call.
Not currently ranked — collecting fresh signals.
star history
What it does
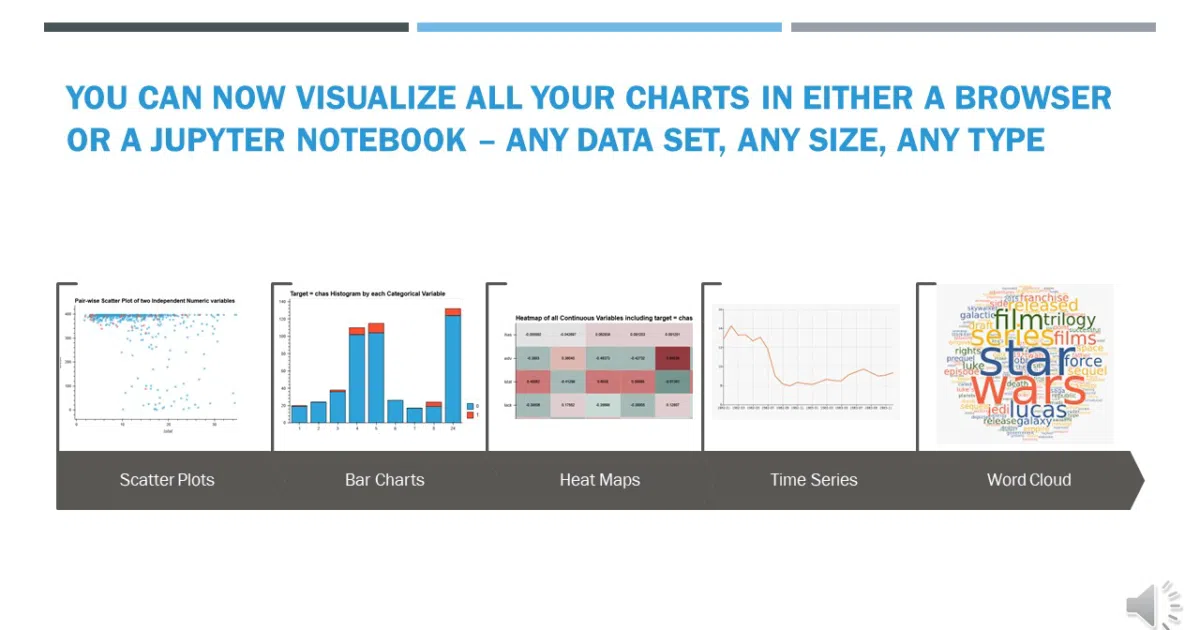
AutoViz ingests a CSV, JSON, txt file, or pandas DataFrame and automatically generates a battery of exploratory charts. It is essentially an orchestration layer over matplotlib, Bokeh, HoloViews, and hvPlot, letting you toggle between static inline images, interactive notebooks, browser dashboards, or saved HTML files. A recent addition, the FixDQ() function, promises to assess data quality and patch issues, though the README is light on exactly what it repairs.
The interesting bit Rather than pretending it can render millions of rows in a browser, the library quietly samples large datasets by default—capping analysis at 150,000 rows and 30 continuous columns and substituting a “statistically valid sample” for the full table. That is a pragmatic admission that “any size” actually means “any size you can reasonably plot.”
Key highlights
- Accepts both file paths and in-memory pandas DataFrames
- Outputs to six formats:
png,svg,jpg,bokeh,server, orhtml - Automatically limits row and column counts for large datasets
- Includes a target-variable mode to bias charts toward a specific dependent variable
- Offers a
verbosesetting that ranges from minimal output to saving every chart locally
Caveats
- Dependency management is fragmented: separate requirements files are needed for Python 3.7, 3.10, and 3.11+
- The README trumpets “any size” but the default hard caps suggest you’ll hit sampling sooner than the marketing implies
FixDQ()is mentioned as a one-line data-quality fix, yet the documentation doesn’t specify what kinds of problems it detects or how it repairs them
Verdict Good for analysts who want a quick, automated first look at a new dataset without writing matplotlib boilerplate. Skip it if you need fine-grained control over aesthetics, statistical methods, or guaranteed full-dataset analysis.
Frequently asked
- What is AutoViML/AutoViz?
- AutoViz eliminates the matplotlib boilerplate of exploratory data analysis by auto-generating charts from a file or dataframe in one call.
- Is AutoViz open source?
- Yes — AutoViML/AutoViz is open source, released under the Apache-2.0 license.
- What language is AutoViz written in?
- AutoViML/AutoViz is primarily written in Python.
- How popular is AutoViz?
- AutoViML/AutoViz has 1.9k stars on GitHub.
- Where can I find AutoViz?
- AutoViML/AutoViz is on GitHub at https://github.com/AutoViML/AutoViz.