wcipriano/pretty-print-confusion-matrix
Matlab-style confusion matrices for Python holdouts
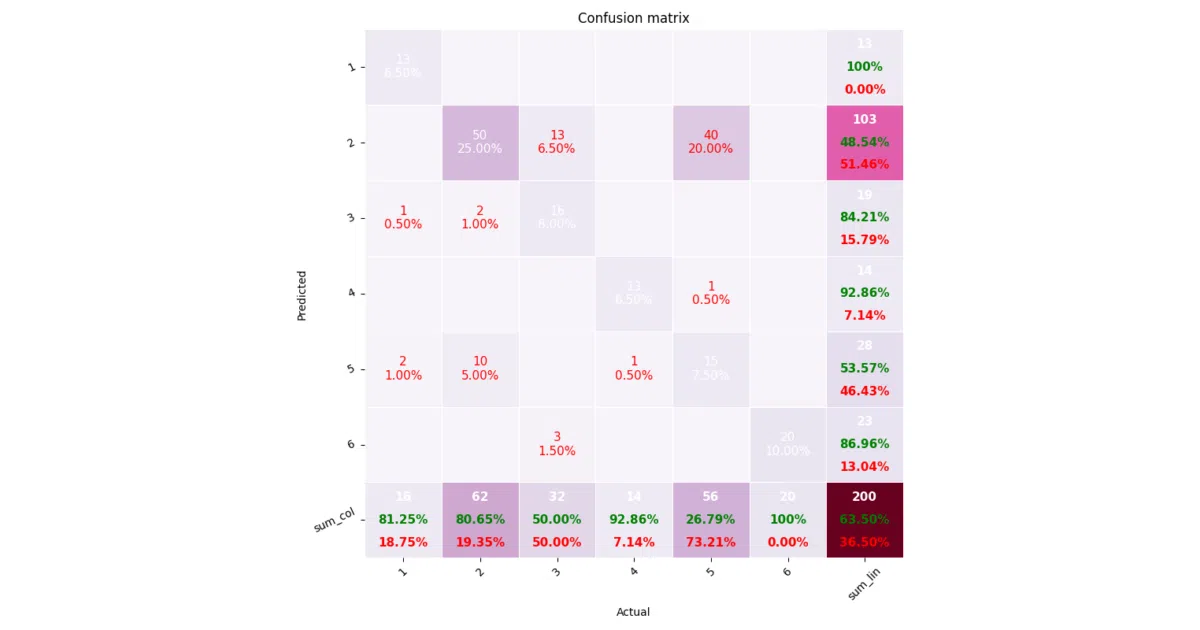
A thin wrapper around seaborn and matplotlib that makes confusion matrices actually readable, with string labels and decent colormaps.
Not currently ranked — collecting fresh signals.
star history
What it does
Takes a NumPy matrix or a pair of y_test/predictions vectors and draws a heatmap. That’s it. Two entry points: pp_matrix for DataFrames, pp_matrix_from_data for raw arrays. You pick a matplotlib colormap and optionally supply string labels for the axes.
The interesting bit
The whole pitch is “like Matlab” — which tells you something about how long Python’s default confusion-matrix plotting has been annoying people. The string-label handling is the practical win; no more squinting at “Class 0, Class 1…” when you meant Dog, Cat, Mouse.
Key highlights
- Accepts pre-built confusion matrices or computes one from two vectors
- Custom axis labels via DataFrame index/columns or a positional
columnsarray - Any matplotlib colormap, queried through standard
colormapslist - Published on PyPI as
pretty-confusion-matrix - Apache-licensed, with CI, code coverage, and a Zenodo DOI
Caveats
- README contains a broken image link (points to
khuyentran1401fork, not this repo) - No API docs beyond the handful of examples shown; parameter reference is absent
- “Become a sponsor” section is longer than the usage instructions
Verdict
Grab it if you’re still hand-rolling sns.heatmap boilerplate for every model evaluation. Skip if you need normalized matrices, per-class metrics, or anything beyond a single pretty picture.
Frequently asked
- What is wcipriano/pretty-print-confusion-matrix?
- A thin wrapper around seaborn and matplotlib that makes confusion matrices actually readable, with string labels and decent colormaps.
- Is pretty-print-confusion-matrix open source?
- Yes — wcipriano/pretty-print-confusion-matrix is open source, released under the Apache-2.0 license.
- What language is pretty-print-confusion-matrix written in?
- wcipriano/pretty-print-confusion-matrix is primarily written in Python.
- How popular is pretty-print-confusion-matrix?
- wcipriano/pretty-print-confusion-matrix has 537 stars on GitHub.
- Where can I find pretty-print-confusion-matrix?
- wcipriano/pretty-print-confusion-matrix is on GitHub at https://github.com/wcipriano/pretty-print-confusion-matrix.