pgosar/ChatGDB
A natural-language interface for debuggers that still segfault
ChatGDB wires ChatGPT into GDB and LLDB so you can type "chat show me the stack trace" instead of memorizing yet another command syntax.
Not currently ranked — collecting fresh signals.
star history
What it does
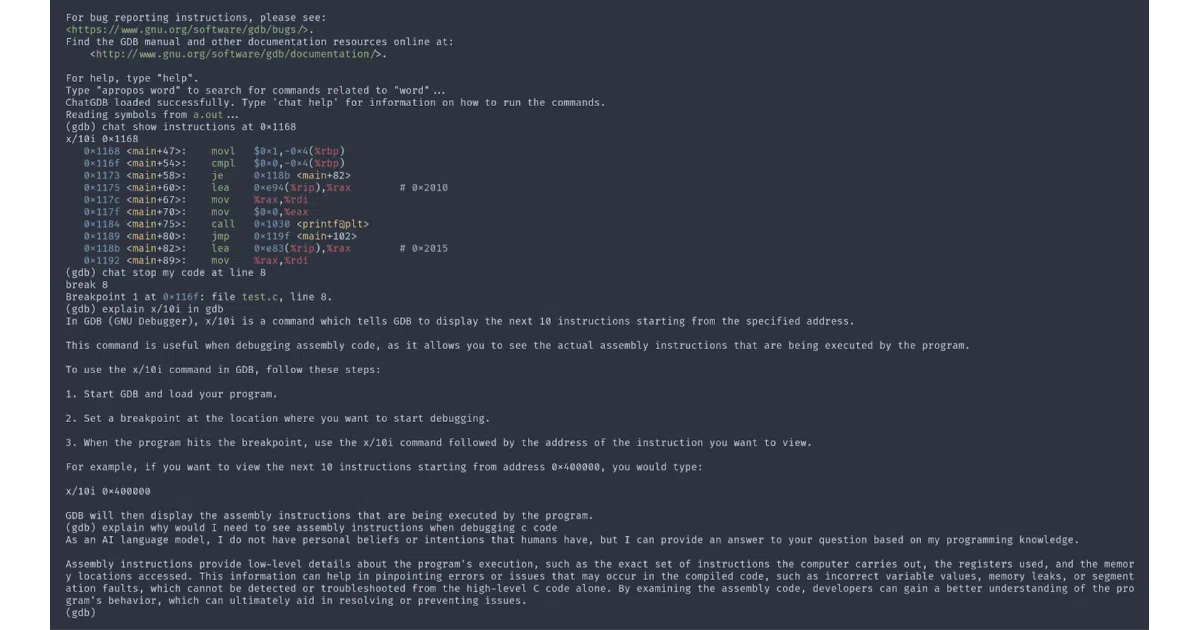
ChatGDB is a Python plugin that drops two commands—chat and explain—into GDB or LLDB. You describe what you want in plain English; it asks ChatGPT to translate that into the actual debugger command and runs it. There’s also an explain command to decode what just happened, or to ask arbitrary questions about your debugging session.
The interesting bit
The real value isn’t AI wizardry—it’s reducing context switching. You stay inside the debugger instead of tabbing out to search “how do I set conditional breakpoint gdb” for the hundredth time. The README hints at future “complete context-awareness” where the tool might actually suggest code fixes, but that’s not implemented yet.
Key highlights
- Supports both GDB and LLDB via
.gdbinit/.lldbinitsourcing - Two models available:
gpt-3.5-turboandgpt-4 - Allows custom API URLs for non-OpenAI providers
explainworks with or without arguments—decode last command or ask freeform questions- Installable via
pip3 install chatgdbwith straightforward key setup
Caveats
- API key stored as plaintext in your Python site-packages directory, which is… not ideal for shared machines
- Requires Python 3.3+; no mention of whether it handles large binary outputs or hangs on slow API responses
- The “exciting features on the horizon” are just promises in the README
Verdict
Worth a spin if you debug compiled languages regularly and treat GDB/LLDB command syntax as hostile territory. Skip it if you already muscle-memory your way through breakpoints, or if sending your debugging context to OpenAI raises eyebrows at your org.
Frequently asked
- What is pgosar/ChatGDB?
- ChatGDB wires ChatGPT into GDB and LLDB so you can type "chat show me the stack trace" instead of memorizing yet another command syntax.
- Is ChatGDB open source?
- Yes — pgosar/ChatGDB is open source, released under the MIT license.
- What language is ChatGDB written in?
- pgosar/ChatGDB is primarily written in Python.
- How popular is ChatGDB?
- pgosar/ChatGDB has 936 stars on GitHub.
- Where can I find ChatGDB?
- pgosar/ChatGDB is on GitHub at https://github.com/pgosar/ChatGDB.