koloai/kolo
A debugger that writes you a novel, not a stack trace
Kolo records every function call, return value, and HTTP request as plain text so both humans and AI agents can grep through execution history.
Not currently ranked — collecting fresh signals.
star history
What it does
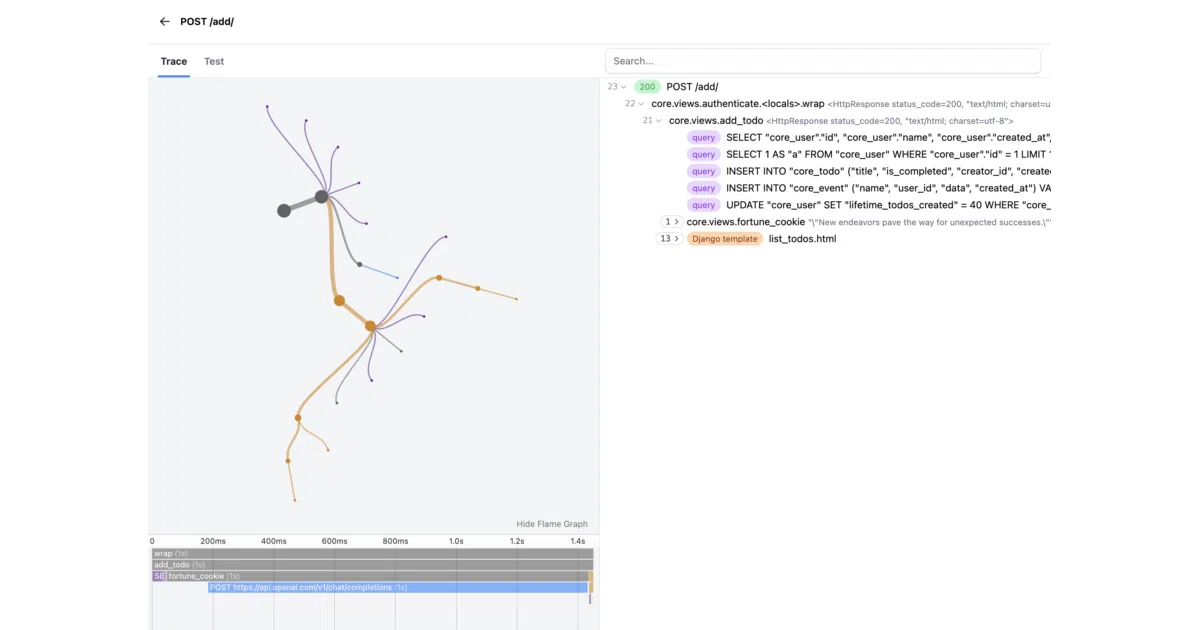
Kolo is a Python debugger that wraps around your code—Django middleware is the quickstart path—and dumps every executed function call, local variable, return value, and HTTP request into trace files. You browse the results at /_kolo/ or read the raw text. It’s pitched at AI agents as much as human developers: the traces are “searchable by humans and agents alike.”
The interesting bit
The v3 pivot to plain text traces is the telling detail. Most debuggers give you a UI or a structured log format; Kolo bets that both you and your LLM will prefer greppable, human-readable execution narratives. The web viewer is still there, but the data format is deliberately primitive.
Key highlights
- One middleware line for Django integration (
"kolo.middleware.KoloMiddleware"at the top ofMIDDLEWARE) - Traces function calls, returns, locals, and SQL queries without code modification
- Web UI at
/_kolo/for visual exploration of traces - Playground at
play.kolo.appfor trying without installing - v3 moved trace data to plain text files as the native format
Caveats
- README examples are Django-centric; support for other frameworks is unclear
- No mention of performance overhead or trace file sizes in production
- 525 stars suggests early traction, not battle-tested scale
Verdict
Worth a look if you’re debugging gnarly Django request flows or building AI agents that need to reason about code execution. Skip it if you need a language-agnostic or production-hardened tracing system.
Frequently asked
- What is koloai/kolo?
- Kolo records every function call, return value, and HTTP request as plain text so both humans and AI agents can grep through execution history.
- Is kolo open source?
- Yes — koloai/kolo is an open-source project tracked on heatdrop.
- How popular is kolo?
- koloai/kolo has 526 stars on GitHub.
- Where can I find kolo?
- koloai/kolo is on GitHub at https://github.com/koloai/kolo.