Zafer-Liu/Data-Analysis-Agent
A local AI analyst that writes SQL and exports PowerPoint
Turns plain-language questions into SQL, charts, and boardroom slides for users who'd rather chat than code.
Velocity · 7d
+2.3
★ / day
Trend
↘cooling
star history
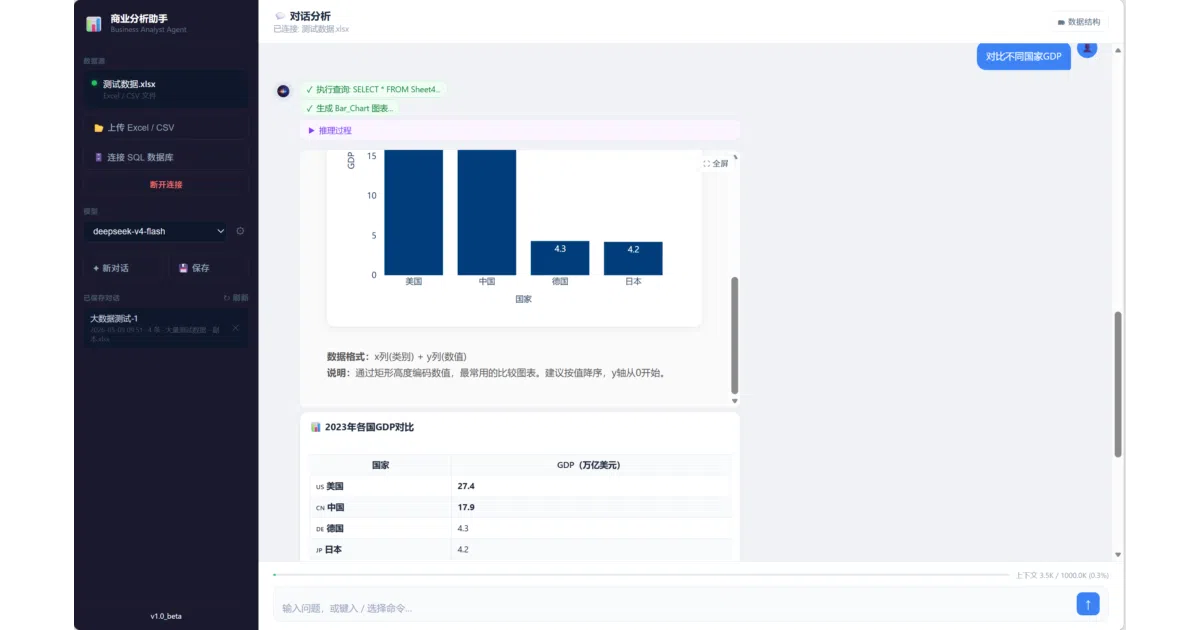
What it does Data-Analysis-Agent is a locally-run Flask application that connects to spreadsheets or SQL databases and lets users ask business questions in plain language. The system uses an LLM to infer intent, inspect schemas, generate and execute SQL, pick an appropriate visualization from 43 Plotly chart types, and summarize business insights. It streams each step to the browser via SSE, so you watch the machine think in real time.
The interesting bit Beyond simple charting, it offers slash-command shortcuts for deeper statistical work—K-Means clustering, decision trees, outlier trimming—plus time-series forecasting with Prophet and ARIMA. It also supports MCP servers and custom knowledge bases, making it less a chat wrapper and more of an extensible analyst that happens to run on your laptop.
Key highlights
- Multi-source ingestion: Excel, CSV, SQLite, MySQL, PostgreSQL, and SQL Server, with DuckDB handling bulk processing under the hood.
- 43 auto-recommended chart types, from Marimekko plots to ridgeline charts.
- Bring-your-own-model: works with DeepSeek, OpenAI, Claude, or any OpenAI-compatible API via configurable base URL.
- Exports to Excel, Word, and styled PowerPoint for when you need to take your findings to a meeting.
- MCP extension support and knowledge-base uploads to ground the agent in domain-specific business context.
Caveats
- The “one-click” install scripts are explicitly marked as unstable; the safer route is downloading the release package.
- Requires an external LLM API key; the README never mentions local or self-hosted model support without an API endpoint.
Verdict Worth a spin for product managers or developers who need fast, conversational ad-hoc analysis without touching SQL. If you need enterprise-grade access control or collaborative dashboards, this is not your tool.
Frequently asked
- What is Zafer-Liu/Data-Analysis-Agent?
- Turns plain-language questions into SQL, charts, and boardroom slides for users who'd rather chat than code.
- Is Data-Analysis-Agent open source?
- Yes — Zafer-Liu/Data-Analysis-Agent is an open-source project tracked on heatdrop.
- What language is Data-Analysis-Agent written in?
- Zafer-Liu/Data-Analysis-Agent is primarily written in JavaScript.
- How popular is Data-Analysis-Agent?
- Zafer-Liu/Data-Analysis-Agent has 2.1k stars on GitHub and is currently cooling off.
- Where can I find Data-Analysis-Agent?
- Zafer-Liu/Data-Analysis-Agent is on GitHub at https://github.com/Zafer-Liu/Data-Analysis-Agent.