Stonesjtu/pytorch_memlab
Find which line of PyTorch code ate your GPU memory
A line-by-line CUDA memory profiler that shows exactly where your tensors are born, live, and refuse to die.
Not currently ranked — collecting fresh signals.
star history
What it does
pytorch_memlab is a debugging toolkit for PyTorch CUDA out-of-memory errors. It provides a line-by-line memory profiler (inspired by line_profiler), a tensor inspector that digs into underlying UntypedStorage objects, and Jupyter/IPython magic commands for interactive use. There’s even a “courtesy” feature to temporarily shove all CUDA tensors to CPU RAM when you need to free up the GPU for something else.
The interesting bit
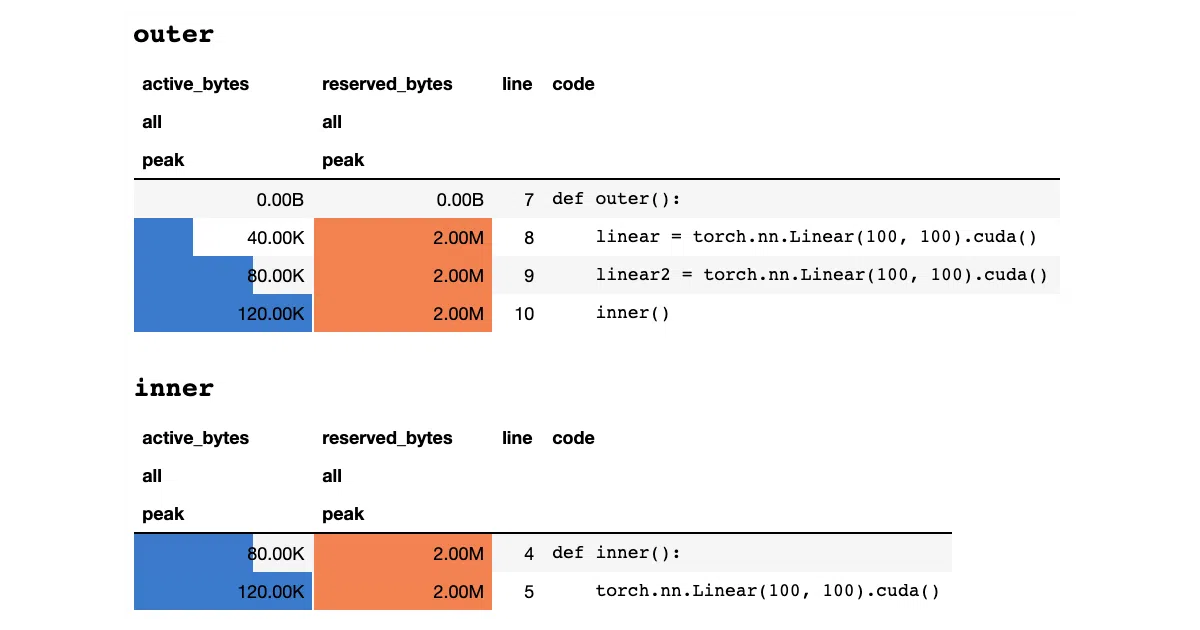
The Memory Reporter doesn’t trust Tensor.size — it walks the actual UntypedStorage objects to report real memory usage, and it tracks storage sharing with (->) annotations so you can see when multiple tensors point to the same underlying buffer. The profiler, meanwhile, hooks each line of your function and reports peak active vs. reserved bytes, which is the difference between “this tensor exists” and “the allocator grabbed a chunk.”
Key highlights
@profiledecorator gives per-line CUDA memory stats (active bytes, reserved bytes, peak usage)MemReporterinspects actualUntypedStorageusage, not surface-level tensor sizes; handles shared weights correctly%mlrun/%%mlrunIPython magics for notebook profiling without code changesset_target_gpufor multi-GPU profiling, though the selection is global state you must manually track- “Courtesy” mode: temporarily migrate all CUDA tensors to CPU and back
Caveats
- GPU target selection is global mutable state; easy to profile the wrong device by accident
- README is truncated mid-example for the LSTM case, so the full verbose output isn’t visible
- No mention of PyTorch 2.x compatibility or
torch.compileinteraction
Verdict
Worth a look if you’re debugging OOMs in training loops and torch.cuda.memory_summary() isn’t granular enough. Less useful if you’re already on PyTorch’s built-in memory profiling or need multi-GPU tracing with automatic device tracking.
Frequently asked
- What is Stonesjtu/pytorch_memlab?
- A line-by-line CUDA memory profiler that shows exactly where your tensors are born, live, and refuse to die.
- Is pytorch_memlab open source?
- Yes — Stonesjtu/pytorch_memlab is open source, released under the MIT license.
- What language is pytorch_memlab written in?
- Stonesjtu/pytorch_memlab is primarily written in Python.
- How popular is pytorch_memlab?
- Stonesjtu/pytorch_memlab has 1.1k stars on GitHub.
- Where can I find pytorch_memlab?
- Stonesjtu/pytorch_memlab is on GitHub at https://github.com/Stonesjtu/pytorch_memlab.