Javis603/token-monitor
Your AI tools burn tokens. This widget counts the ashes.
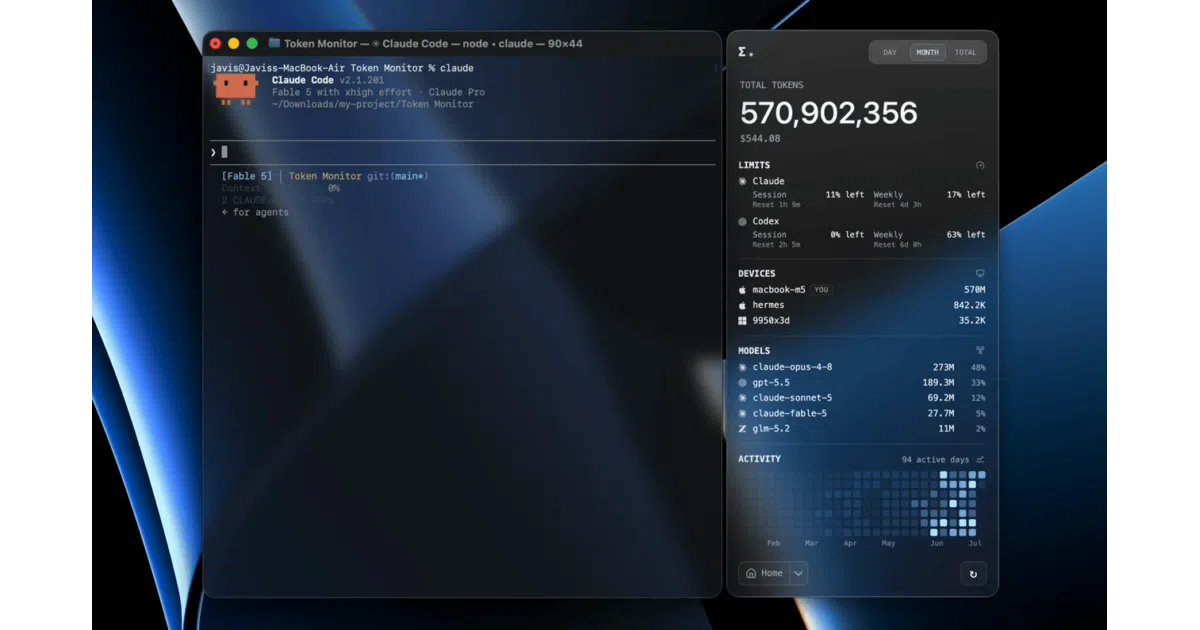
Token Monitor reads local logs from two dozen AI coding tools to surface live token burn, costs, and limits in one place, synced across all your machines.
Velocity · 7d
+31
★ / day
Trend
↘cooling
star history
What it does
Token Monitor is a desktop widget that treats your local filesystem as a telemetry source, scraping logs and databases from AI coding tools like Claude Code, Cursor, Codex, and roughly two dozen others to show live token counts, session costs, and account limits. It works offline by default, reading paths such as ~/.claude/projects/ or ~/.config/tokscale/cursor-cache/, and optionally syncs summary statistics across devices via a self-hosted hub.
The interesting bit
Rather than polling cloud APIs for usage, the app reads local transcripts, session databases, and cache directories directly—so it knows what happened even when you were offline. The multi-device sync is deliberately privacy-first: only summary numbers leave your machine, and the sync hub can live inside the widget, as a headless Node process, or on a Cloudflare Worker.
Key highlights
- Supports ~20 tools with uneven depth: full per-prompt session breakdowns for Claude Code, Codex, and OpenCode; raw token counts for Cline, Zed, Kimi, and others; API quota checks for DeepSeek, Grok, Cursor, and more.
- Automatically detects usage from AI tools running inside WSL on Windows and merges it into your totals.
- Includes a floating bubble mode, menu bar or system tray popover with live costs, and a global shortcut to toggle visibility.
- Exports usage data as CSV and JSON for spreadsheets, Obsidian, or Grafana.
- Offers optional service status checks for Claude, OpenAI, Cursor, and DeepSeek.
Caveats
- Multi-device sync requires an always-on hub; quitting the widget stops the hub and disconnects all linked devices.
- WSL usage refreshes only on a periodic scan roughly every five minutes, so it is not instantaneous.
- Support depth varies significantly by tool: some get cache-hit statistics and per-reply splits, while others report only basic token counts or API limits.
Verdict
Grab this if you juggle multiple AI coding tools across several machines and want a single place to watch burn rate and quota limits. Skip it if you only use one tool with a simple web dashboard—you probably don’t need a whole widget for that.
Frequently asked
- What is Javis603/token-monitor?
- Token Monitor reads local logs from two dozen AI coding tools to surface live token burn, costs, and limits in one place, synced across all your machines.
- Is token-monitor open source?
- Yes — Javis603/token-monitor is open source, released under the MIT license.
- What language is token-monitor written in?
- Javis603/token-monitor is primarily written in JavaScript.
- How popular is token-monitor?
- Javis603/token-monitor has 2.7k stars on GitHub and is currently cooling off.
- Where can I find token-monitor?
- Javis603/token-monitor is on GitHub at https://github.com/Javis603/token-monitor.