microsoft/flint-chart · 09 Aug 2026 · Feature
Microsoft's Bet on an Intermediate Language for AI Charts

Olivia Hartman
Editor
Flint is a visualization compiler that lets AI agents write compact, semantic chart specs while it handles the fragile low-level details of multiple rendering backends.
microsoft/flint-chart
★3.9k stars Velocity · 7d +385 ★/day ↗accelerating
star history
The Agent’s Handicap
Every AI agent that has ever tried to generate a chart from a CSV file has, at some point, produced a monstrosity. The axes overlap. The color scheme is aggressively random. The padding is either nonexistent or large enough to qualify as a separate canvas. As Microsoft Research notes, agents are especially prone to errors when managing the verbose, low-level parameters that polished visualizations require, and the resulting code is often difficult for people to inspect, repair, or reuse [6]. This is not a minor inconvenience. It is a structural failure in the agent stack.
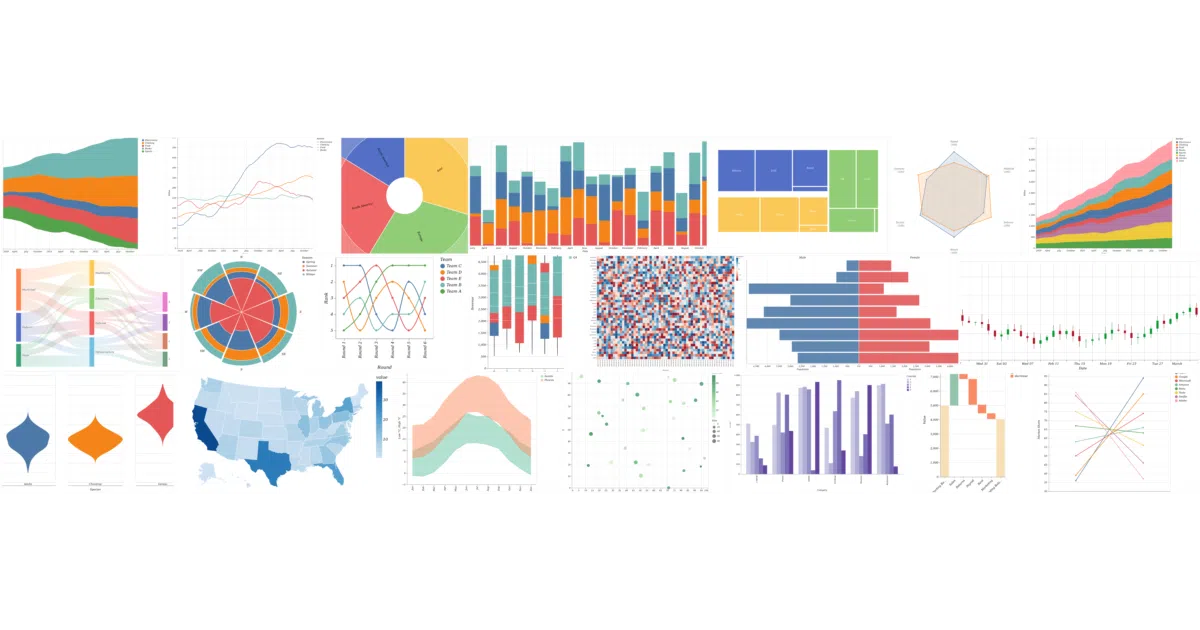
The current market for AI data visualization is crowded with end-user salves. SaaS platforms like ChartGen AI, Graphy, and Venngage promise to convert raw data into presentation-ready charts in seconds [3][5][11]. Enterprise BI suites—Domo, ThoughtSpot, Tableau—have bolted on natural-language copilots that generate dashboards and SQL queries [2][4]. Even generalist LLMs like Grok and Gemini will now spit out Chart.js or interactive SVG when asked, though they often fail on complex requests like radar or scatter plots and produce verbose, hard-to-edit output [8]. Yet most of these solutions treat the agent as a black-box consumer or a code generator writing directly against rendering APIs. They do not solve the underlying problem: agents are bad at graphic design, and humans are bad at debugging agent-generated graphic design code.
An Intermediate Language, Not Another Library
Flint, open-sourced by Microsoft Research in collaboration with Renmin University’s IDEAS Lab, is not another charting library. It is an intermediate language and compiler [1][6]. The distinction matters. Where D3, Vega-Lite, ECharts, and Chart.js are renderers, Flint sits one layer above, translating a compact, high-level specification into backend-native code. A single Flint input can compile to Vega-Lite, Apache ECharts, Chart.js, Plotly, or even native Excel templates via Office.js [1][12].
The specification itself is deliberately small. It consists of the data, a set of semantic types describing what each field actually means, and a chart declaration that defines the chart type and encodings [12]. The compiler does the rest: it infers parsing rules, scales, axes, aggregations, formatting, color schemes, cell sizing, legend configuration, and layout [6]. If you want to switch from an ECharts dashboard to a Vega-Lite research figure, you change the target backend, not the specification. That backend portability is the architectural bet.
Semantics as a Layout Engine
The boring part of Flint is where its intelligence lives. The compiler recognizes more than seventy semantic types—Profit, Temperature, Country, YearMonth, Rank, Delta—and uses them to drive automated design decisions [1][12]. A field marked Profit might trigger a diverging red-blue color scale centered on zero. A YearMonth field gets temporal parsing and appropriate axis formatting without the agent having to specify a time format string [12]. This is not merely type inference; it is domain-aware compilation.
Flint’s layout engine is similarly elastic. It adjusts sizing, spacing, band widths, and label density based on data cardinality and canvas constraints [1][6]. The compiler banks on the idea that an agent should not be calculating how many pixels to reserve for a fifty-category bar chart, or whether a scatter plot with ten thousand points needs a smaller mark size. Those are algorithmic concerns, not creative ones, and Flint treats them as such. The compiler also supports a formal theme specification, allowing a visual identity to be defined once and applied consistently across backends [1].
The result is a chart specification that is human-editable and agent-writable. Because the spec is compact JSON, a person can open it, change the chart type from a scatter plot to a heatmap, and recompile without touching a single scale domain or legend offset [1]. That readability is a feature, not an afterthought. It addresses the repairability problem that plagues raw code generation.
MCP and the Middleware Play
Flint ships as two npm packages: flint-chart, the core TypeScript compiler, and flint-chart-mcp, a Model Context Protocol server that exposes chart creation, validation, and rendering tools directly inside chat and coding environments [1][6]. For agents operating inside MCP-capable hosts, this means they can generate a chart, open an interactive preview, or export a static PNG without leaving the conversation thread [1]. There is also a standalone agent skill for non-MCP workflows, acknowledging that the protocol is not yet universal [12].
This positioning reveals the project’s intended audience. Flint is not competing with Graphy or Venngage for the marketing team that wants a branded funnel chart in four hours [5][11]. It is infrastructure for the developers building those agents. By offering an MCP server, Microsoft is betting that the agent integration layer—standardized tool calling inside IDEs and chat clients—will be the primary distribution channel for AI-generated visualization, not a standalone web app.
The Hacker News Question
The project has already attracted skepticism. According to one observer, Hacker News debate has centered on whether AI agents need an intermediate specification language at all, or whether they should simply write native Vega-Lite or Plotly code directly [12]. It is a fair question. If large language models are going to generate code anyway, why insert another abstraction?
The answer Flint offers is twofold: backend portability and human editability. Native code locks the visualization to one renderer’s API. It also tends to be verbose—Microsoft Research explicitly notes that polished visualizations in existing libraries require “verbose, fragile, and error-prone low-level parameters” [6]. An intermediate representation keeps the intent stable while the compiler absorbs the API differences and the layout fragility. Whether that trade-off is worth the extra dependency depends on whether the agent ecosystem standardizes around compilers like Flint or continues to let each agent reinvent chart generation with slightly different prompt wrappers. The gallery of roughly fifty chart types and over a hundred rendered examples suggests the team is trying to prove the compiler can cover enough of the long tail to be worth the abstraction [12].
Rough Edges and the Long View
Flint is still early. The Python port exists only as a source-only preview in the repository, with a proper package release pending [1]. The real test will be whether agent builders adopt the MCP server or default to asking an LLM to write ECharts options directly. The project had reportedly accumulated 2.7k GitHub stars shortly after its open-source release, suggesting curiosity, but stars are not integrations [12].
The broader landscape does not make adoption easy. The AI visualization space is fragmenting into end-user SaaS tools, enterprise BI copilots, and raw code-generation agents [2][4][7]. Flint’s challenge is to convince developers that chart generation is a compilation problem, not a prompting problem. If it succeeds, it could become the default intermediate representation for agent-authored graphics—a kind of portable assembly language for data visualization. If it fails, it risks becoming a well-engineered solution to a problem that most users will simply ask a generalist LLM to handle instead. For now, it is one of the more rigorous attempts to bring software engineering discipline to a field currently dominated by prompt engineering and hope.
Sources
- Flint: A Visualization Language for the AI Era - Microsoft Open Source
- AI Data Visualization Tools: 8 Picks Compared for 2026 - Domo
- ChartGen AI | Free AI Chart Generator
- Best AI Tools for Data Visualization in 2026 (Reviewed) - ThoughtSpot
- Graphy - Make Beautiful Graphs Online For Free with AI
- Flint: A visualization language for the AI era - Microsoft Research
- I built an AI Data Visualization AI Agent that writes its own code ...
- 10 Tools for Generating Charts for Presentations with AI - SlideSpeak
- Flint Chart download | SourceForge.net
- I Tried Building an AI Agent for My Data — Here's What I Built Instead
- Free AI Chart Generator - Beautiful Charts in Seconds from Text
- Flint Chart: Microsoft's AI Visualization Language (2026) | explainx.ai Blog