whoiskatrin/chart-gpt
Type a sentence, get a chart: the laziest data viz tool yet
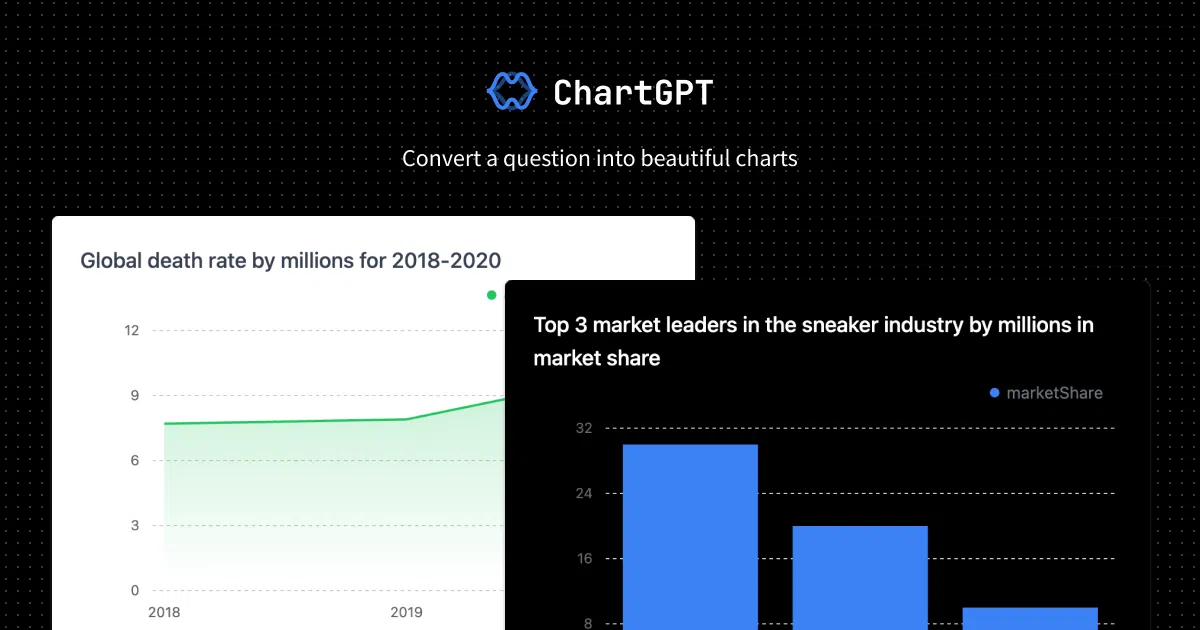
A Next.js app that turns plain English into rendered charts via Google's PaLM API.
Not currently ranked — collecting fresh signals.
star history
What it does Chart-GPT is a web app that takes text descriptions and generates charts. You type something like “quarterly revenue by region,” and it produces a visual output. Under the hood it’s a Next.js application calling Google’s PaLM (Bard) API to interpret the prompt and return chart data.
The interesting bit The project bundles a full SaaS skeleton out of the box — Supabase for data, Stripe for payments, NextAuth for Google login — which is either convenient scope creep or a reminder that even weekend projects now ship with billing infrastructure. The chart rendering itself is the thinner layer; the plumbing is where the work went.
Key highlights
- Text-to-chart via PaLM API (requires
BARD_KEYenv var) - Next.js + TypeScript codebase
- Credit/payment system via Stripe integration
- Auth via NextAuth with Google provider
- Database layer via Supabase
Caveats
- README is sparse on actual chart types, accuracy, or prompt engineering details
- Requires four external services (PaLM, Supabase, Stripe, Google OAuth) for full functionality
- The name “Chart-GPT” is slightly misleading — it uses PaLM/Bard, not OpenAI’s GPT models
Verdict Worth a spin if you need a quick prototype for “AI-generated dashboards” or want to study a minimal SaaS boilerplate. Skip it if you need production-grade data visualization or care about model transparency.
Frequently asked
- What is whoiskatrin/chart-gpt?
- A Next.js app that turns plain English into rendered charts via Google's PaLM API.
- Is chart-gpt open source?
- Yes — whoiskatrin/chart-gpt is open source, released under the Apache-2.0 license.
- What language is chart-gpt written in?
- whoiskatrin/chart-gpt is primarily written in TypeScript.
- How popular is chart-gpt?
- whoiskatrin/chart-gpt has 3.6k stars on GitHub.
- Where can I find chart-gpt?
- whoiskatrin/chart-gpt is on GitHub at https://github.com/whoiskatrin/chart-gpt.