uber/manifold
Uber's debugger for when your model 'works' except where it doesn't
A visual tool that clusters your model's failures to show which data slices and features are actually causing the pain.
Not currently ranked — collecting fresh signals.
star history
What it does
Manifold takes your model’s predictions, ground truth, and raw features, then visually surfaces where your model fails and what distinguishes those failures from successes. It works with any model—hence “model-agnostic”—as long as you can feed it the prediction arrays. You get a demo app for one-off CSV uploads or a React component to embed in your own pipeline.
The interesting bit
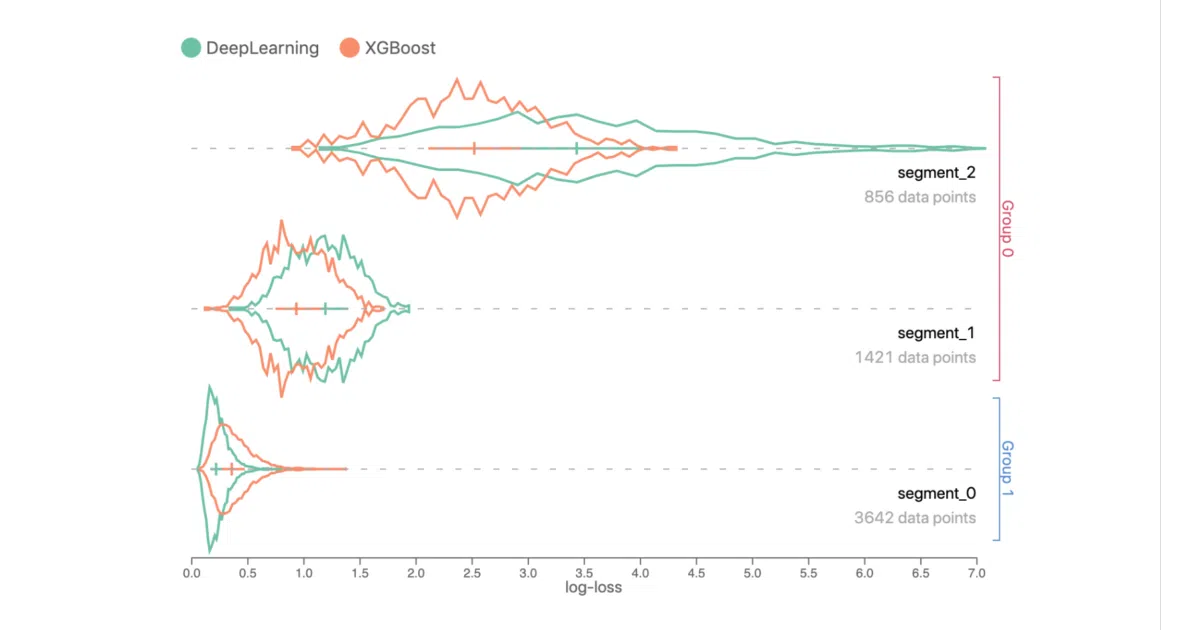
The tool doesn’t just plot aggregate AUC or RMSE. It uses k-Means clustering on per-instance performance scores to auto-segment your data into groups with similar error patterns, then ranks features by KL-Divergence between high-error and low-error slices. The geo view even handles Uber’s H3 hexagons natively—unsurprising given the source, but useful if your failures cluster spatially.
Key highlights
- Performance Comparison View: clusters data by error similarity across models, letting you spot which model wins on which slice
- Feature Attribution View: histograms and heatmaps ranked by distribution divergence between segment groups
- Geo Feature View: lat/lng and H3 hex ID support with heatmap and aggregate hexagon coloring
- Component or demo app: embed via React or run locally with
yarn startatlocalhost:8080 - Recommended dataset size: 10,000–15,000 instances; larger sets can be randomly subsampled
Caveats
- The README notes a typo in “supoorted” for geo features and “intrisic” for opacity—small, but suggests maintenance attention may be uneven
- Project is “stable and being incubated for long-term support”—not abandoned, but not actively evolving either
- Data format is rigid:
x,yPred, andyTruemust align perfectly by instance order
Verdict
Worth a look if you’re debugging production models and tired of aggregate metrics hiding slice-specific failures. Skip it if you need real-time monitoring or automated remediation—this is exploratory analysis, not ops.
Frequently asked
- What is uber/manifold?
- A visual tool that clusters your model's failures to show which data slices and features are actually causing the pain.
- Is manifold open source?
- Yes — uber/manifold is open source, released under the Apache-2.0 license.
- What language is manifold written in?
- uber/manifold is primarily written in JavaScript.
- How popular is manifold?
- uber/manifold has 1.7k stars on GitHub.
- Where can I find manifold?
- uber/manifold is on GitHub at https://github.com/uber/manifold.