shanselman/gputaskman
htop for the inside of your GPU, from Scott Hanselman
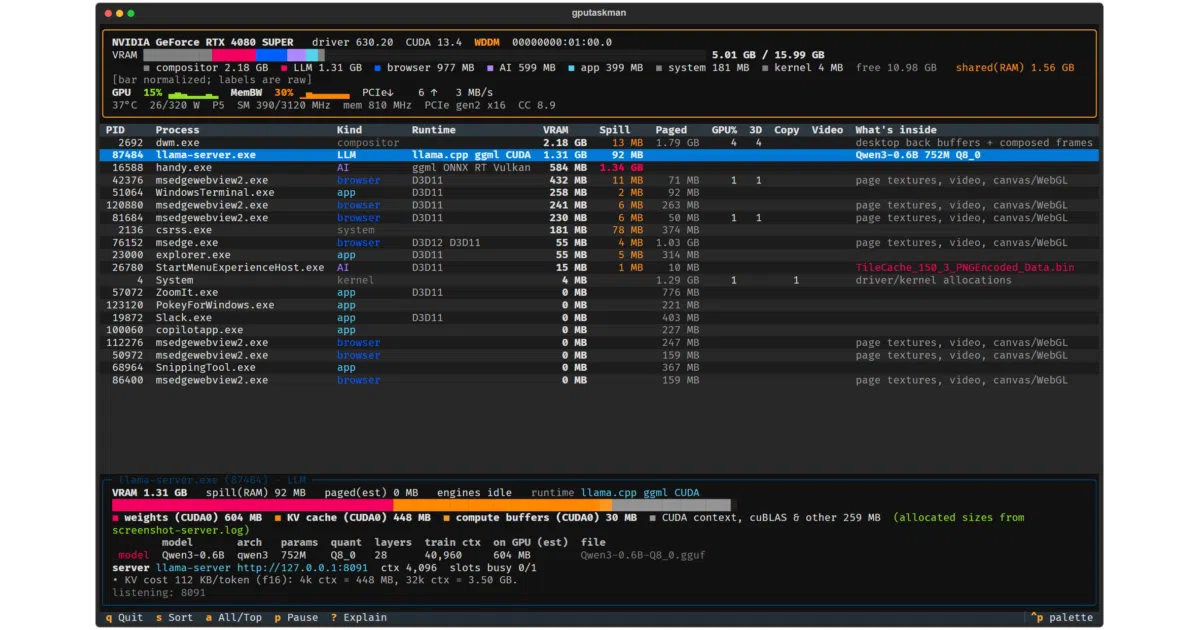
A terminal UI that answers the question Task Manager refuses to: which process ate 15 GB of VRAM, and is it model weights or KV cache?
Collecting fresh signals — velocity needs a few days of history.
collecting data…
star history
What it does
gputaskman is a Python TUI that shows per-process GPU memory and engine activity, then goes a layer deeper: it correlates processes with loaded runtimes, mapped model files, and — for LLM runners like Ollama — a weights / KV-cache / compute-buffer breakdown. It runs on Windows (NVIDIA and AMD), Linux and WSL, and macOS on Apple Silicon, with portable builds that need no Python, CUDA Toolkit, or model downloads. It’s explicitly local-only: cloud and NPU workloads are out of scope.
The interesting bit
The honest accounting. Where a counter can’t be measured — spill on native Linux, per-process load in WSL, shared DRM buffers on amdgpu — it shows blank or n/a and says why, rather than displaying a confident zero. The container support is genuinely clever: NVML reports host PIDs that mean nothing inside Docker, so gputaskman pairs them with container processes by creation order, flagging matches with * or ? and labeling leftovers as H:<pid> (someone else’s container).
Key highlights
- Per-process VRAM, GPU load, and LLM buffer breakdowns (weights vs. KV cache vs. compute) with evidence-based model identification — a mapped GGUF alone doesn’t count as proof.
- AMD on native Linux needs no ROCm or AMD SMI: it reads
/proc/<pid>/fdinfoand sysfs directly, including GTT-as-spill semantics and APU carve-out handling. - JSON output uses
nullfor unknowns, never a fake zero, and includes reasons likevram_unattributed_reason. - Runs fully offline after install; no admin rights, API keys, or CUDA Toolkit required.
--onceand--jsonmodes make it scriptable, not just watchable.
Caveats
- Self-described as early and experimental: device counters are measurements, but classifications and GGUF-derived breakdowns are estimates.
- Windows portable builds are unsigned.
- AMD coverage is uneven — the live AMD check on Windows couldn’t read temperature, memory activity, or PCIe, and ROCm/HIP per-process engine load is
n/aon Linux.
Verdict
Anyone running local LLMs who’s ever wondered why VRAM vanished should install this immediately. If you just want a GPU utilization percentage, nvidia-smi already exists.
Frequently asked
- What is shanselman/gputaskman?
- A terminal UI that answers the question Task Manager refuses to: which process ate 15 GB of VRAM, and is it model weights or KV cache?
- Is gputaskman open source?
- Yes — shanselman/gputaskman is open source, released under the MIT license.
- What language is gputaskman written in?
- shanselman/gputaskman is primarily written in Python.
- How popular is gputaskman?
- shanselman/gputaskman has 1.1k stars on GitHub.
- Where can I find gputaskman?
- shanselman/gputaskman is on GitHub at https://github.com/shanselman/gputaskman.