philipperemy/deep-learning-bitcoin
Teaching CNNs to read Bitcoin tea leaves
A 2017 experiment that treats price charts as images and asks AlexNet to guess which way the candlestick winds.
Not currently ranked — collecting fresh signals.
star history
What it does
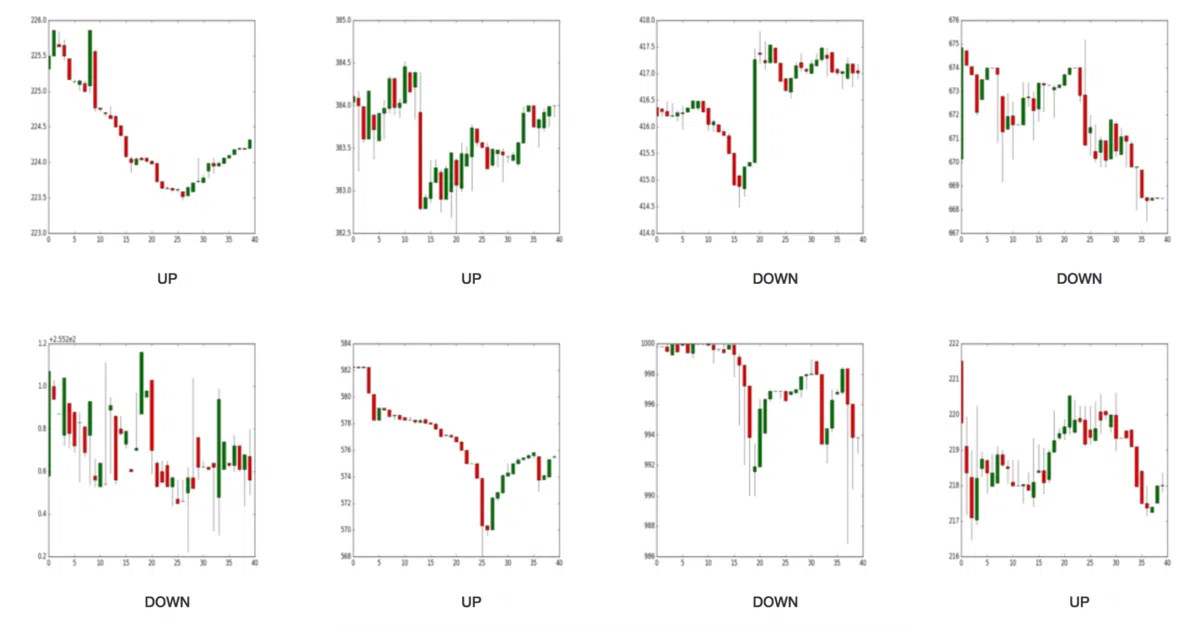
Downloads Coinbase tick data, resamples it into 5-minute OHLC bars, renders those bars as images, and trains a convolutional neural network to classify whether Bitcoin will go up or down. The project also experiments with quantifying how much the price moves, not just the direction.
The interesting bit
The “raw pixels” conceit — treating financial time series as computer vision problems, like OpenAI playing Atari. It’s a deliberately naive approach that sidesteps feature engineering by asking the network to learn pattern recognition from candlestick shapes directly.
Key highlights
- Achieves ~70% directional accuracy on 20,000 samples using AlexNet via NVIDIA DIGITS and Caffe
- Generates labeled training images from OHLC data with configurable binning strategies (direction-only vs. return magnitude)
- Includes Docker setup and data pipeline scripts for reproducibility
- Designed to scale to 1M+ samples with deeper architectures (LeNet, attention mechanisms)
Caveats
- Marked Work In Progress; several roadmap items (larger datasets, volume integration, CNN attention) remain unchecked
- 70% accuracy on 20K samples is a modest result with no validation metrics or walk-forward testing shown
- Uses Caffe and DIGITS — tooling that has since fallen out of mainstream favor
Verdict
Worth a look for researchers curious about vision-based approaches to financial prediction, or anyone teaching the “don’t engineer features, let the network see” philosophy. Not a production trading system; the value is in the experimental framing rather than the results.
Frequently asked
- What is philipperemy/deep-learning-bitcoin?
- A 2017 experiment that treats price charts as images and asks AlexNet to guess which way the candlestick winds.
- Is deep-learning-bitcoin open source?
- Yes — philipperemy/deep-learning-bitcoin is open source, released under the Apache-2.0 license.
- What language is deep-learning-bitcoin written in?
- philipperemy/deep-learning-bitcoin is primarily written in Python.
- How popular is deep-learning-bitcoin?
- philipperemy/deep-learning-bitcoin has 530 stars on GitHub.
- Where can I find deep-learning-bitcoin?
- philipperemy/deep-learning-bitcoin is on GitHub at https://github.com/philipperemy/deep-learning-bitcoin.