antvis/Infographic
When your LLM is mid-sentence but already sketching the slide
AntV Infographic is a declarative rendering engine that turns text syntax into SVG graphics, built specifically so LLMs can stream and progressively render data visualizations in real time.
Not currently ranked — collecting fresh signals.
star history
What it does
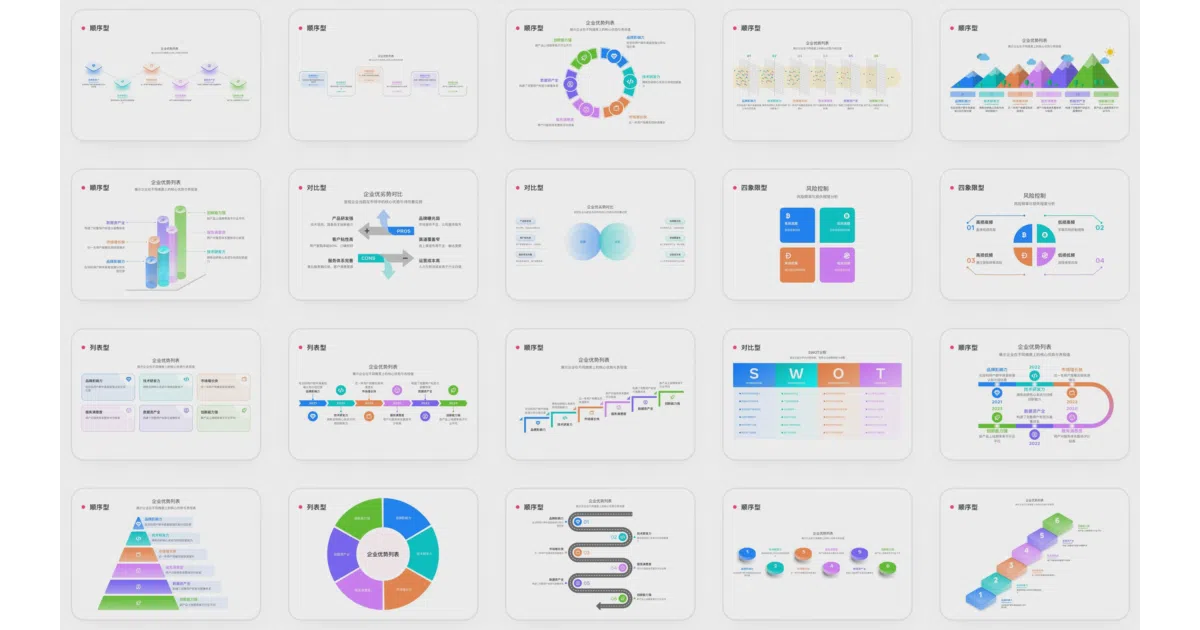
AntV Infographic is a declarative visualization engine that converts a custom text syntax into high-quality SVG infographics. It ships with roughly 200 built-in templates, layouts, and data-item components, backed by a theme system that covers hand-drawn styles, gradients, and patterns. A built-in editor lets you tweak AI-generated output after the fact.
The interesting bit
The syntax is deliberately fault-tolerant so the engine can render progressively while an LLM is still streaming tokens. Rather than waiting for a complete payload, it consumes partial output and updates the SVG on the fly. It also packages skills for Claude Code and Codex, letting agents generate syntax and HTML directly.
Key highlights
- ~200 built-in infographic templates and components
- SVG-first output for visual fidelity and easy post-editing
- Real-time progressive rendering from streaming AI output
- Built-in editor to refine generated diagrams
- Theme presets including hand-drawn, gradients, and patterns
Verdict
Worth a look if you’re building AI agents or documentation tools that need instant, templated visuals without managing a design stack. Skip it if you need free-form creative illustration rather than structured, data-driven layouts.
Frequently asked
- What is antvis/Infographic?
- AntV Infographic is a declarative rendering engine that turns text syntax into SVG graphics, built specifically so LLMs can stream and progressively render data visualizations in real time.
- Is Infographic open source?
- Yes — antvis/Infographic is open source, released under the MIT license.
- What language is Infographic written in?
- antvis/Infographic is primarily written in TypeScript.
- How popular is Infographic?
- antvis/Infographic has 5.6k stars on GitHub.
- Where can I find Infographic?
- antvis/Infographic is on GitHub at https://github.com/antvis/Infographic.