amosjyng/langchain-visualizer
LangChain's Black Box, Now With Color-Coded Guts
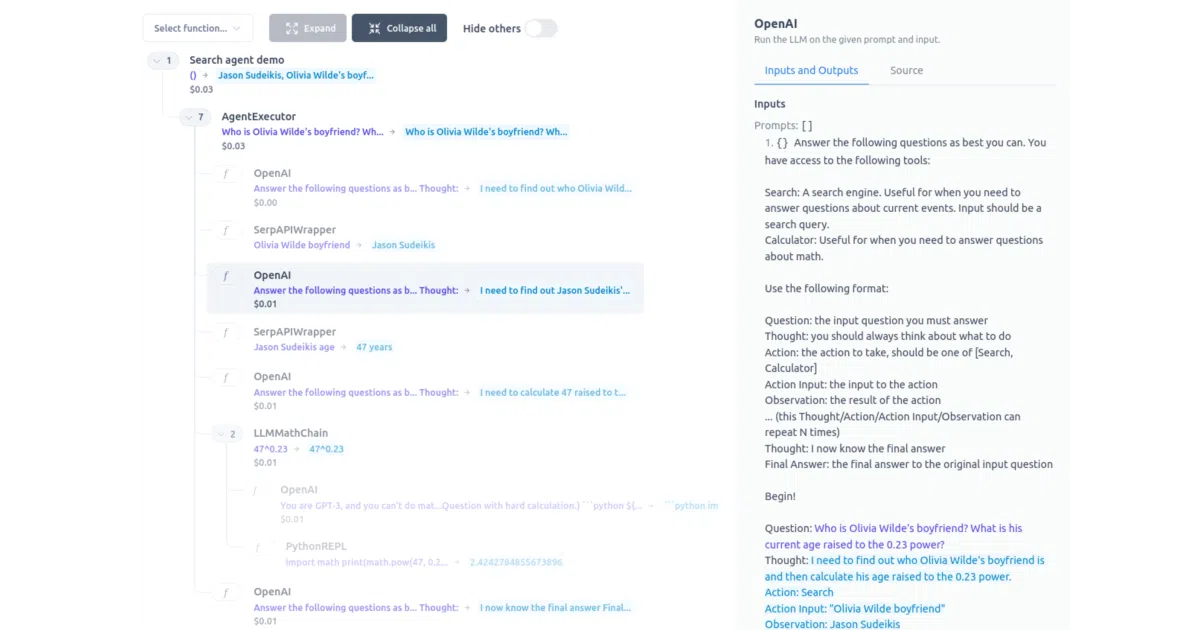
It grafts Ought's ICE visualizer onto LangChain to expose the full prompt text, template substitutions, and execution flow that the default tracer keeps out of reach.
Not currently ranked — collecting fresh signals.
star history
What it does
This project is an adapter that instruments LangChain workflows to render inside Ought’s ICE visualizer UI. You wrap an async function in langchain_visualizer.visualize(), and a browser window opens showing a navigable trace of every LLM call, tool invocation, and prompt that flows through your chain. The UI color-codes hardcoded prompt instructions versus dynamic template substitutions, and it can tally per-call and total run costs when using OpenAI’s text-davinci-003.
The interesting bit
Rather than adding a simple logger, the author “hijacks” LangChain internals to emit granular events—most notably the exact moment tools like PythonREPL execute, which the built-in tracer apparently obscures. The README also makes a subtle but telling point: when LLM responses are cached, LangChain’s native trace can shift or simplify, whereas this visualizer keeps the agent’s logic tree static and inspectable regardless of cache hits.
Key highlights
- Surfaces complete prompt text with color-coded hardcoded vs. templated sections.
- Traces execution flow down to individual tool invocations rather than only high-level chain steps.
- Displays per-call and total run costs for OpenAI
text-davinci-003. - Supports Jupyter notebooks via a separate
langchain_visualizer.jupyterimport path. - Can visualize document chunking for embeddings when
visualize_embeddings()is called first.
Caveats
- The author warns that much of LangChain’s surface area hasn’t been instrumented yet, so expect gaps in trace coverage.
- Cost estimates are only mentioned for OpenAI’s
text-davinci-003, leaving other models or providers unaccounted for. - It must be imported as the very first module in your entrypoint, which hints at a preemptive monkey-patching strategy that could clash with other instrumentation.
Verdict
Worth a look if you are debugging complex LangChain agents and need to see literal prompts, template boundaries, and exact tool firing order rather than chain summaries. If you are already content with LangChain’s built-in tracer or your chains are simple enough that prompt inspection is overkill, you can probably skip it.
Frequently asked
- What is amosjyng/langchain-visualizer?
- It grafts Ought's ICE visualizer onto LangChain to expose the full prompt text, template substitutions, and execution flow that the default tracer keeps out of reach.
- Is langchain-visualizer open source?
- Yes — amosjyng/langchain-visualizer is open source, released under the MIT license.
- What language is langchain-visualizer written in?
- amosjyng/langchain-visualizer is primarily written in Python.
- How popular is langchain-visualizer?
- amosjyng/langchain-visualizer has 737 stars on GitHub.
- Where can I find langchain-visualizer?
- amosjyng/langchain-visualizer is on GitHub at https://github.com/amosjyng/langchain-visualizer.