HendrikStrobelt/LSTMVis
Peering inside the LSTM black box, circa 2016
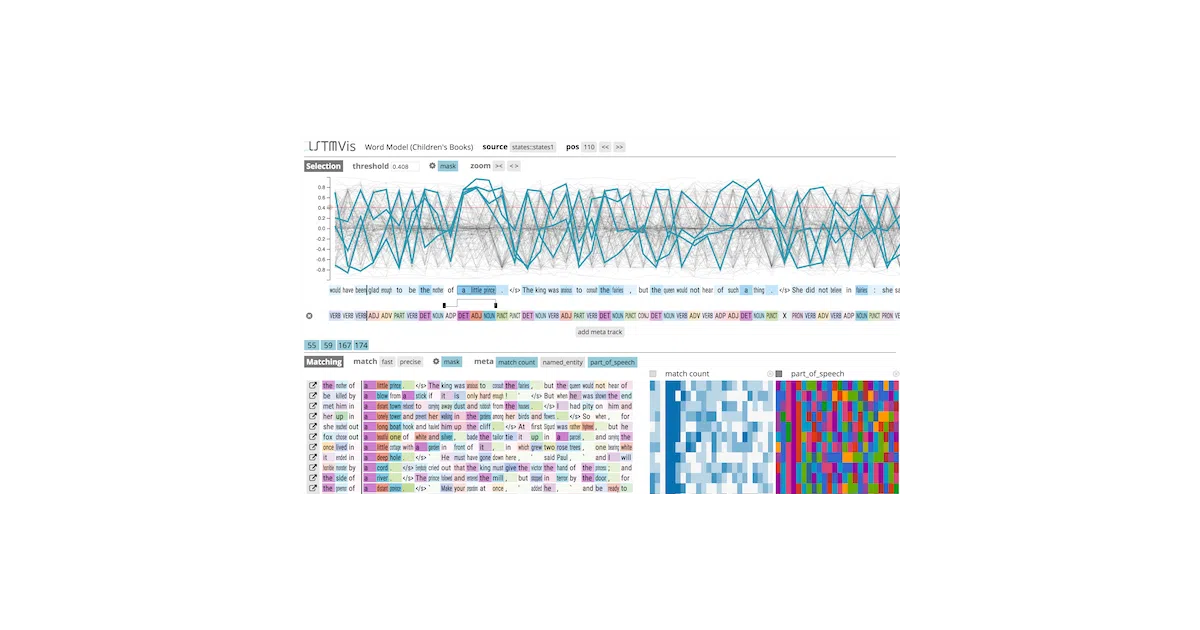
A browser-based tool to visualize how hidden states evolve across time steps in recurrent networks.
Not currently ranked — collecting fresh signals.
star history
What it does LSTMVis is a local web server that plots hidden-state trajectories of trained LSTMs. You feed it HDF5 files containing per-timestep state vectors and word IDs, configure a YAML file pointing to those layers, and browse to localhost:8888 to explore. It ships with a 2.2 GB children’s book dataset and a tiny parenthesis dataset so you can see the UI without training anything.
The interesting bit The tool treats the LSTM’s hidden state as a signal you can zoom and pan across time—less “attention heatmap,” more “oscilloscope for recurrent memory.” The V2 rewrite moved the client to ES6 and D3v4 and added annotation tracks, so you can overlay predictions or metadata alongside the state curves.
Key highlights
- Supports Torch, TensorFlow, and Keras extraction workflows (the latter via community tutorial)
- Discrete zooming on hidden-state tracks to inspect specific time ranges
- Annotation tracks for metadata and model predictions
- Data format is deliberately simple: states.hdf5, train.hdf5, and a .dict mapping file
- Harvard SEAS project with a live demo still hosted at lstm.seas.harvard.edu
Caveats
- Requires Python 3.7+; the original bower-based client install is commented out and possibly stale
- No GPU acceleration mentioned—this is a post-hoc analysis tool, not a training framework
- The README notes “some performance enhancements” in V2, which is faint praise for a browser client handling long sequences
Verdict Worth a spin if you’re debugging why your LSTM mispredicts at specific timesteps and you want to eyeball state dynamics. Skip it if you need integrated training+viz in one pipeline, or if you’re working exclusively with transformers.
Frequently asked
- What is HendrikStrobelt/LSTMVis?
- A browser-based tool to visualize how hidden states evolve across time steps in recurrent networks.
- Is LSTMVis open source?
- Yes — HendrikStrobelt/LSTMVis is open source, released under the BSD-3-Clause license.
- What language is LSTMVis written in?
- HendrikStrobelt/LSTMVis is primarily written in Jupyter Notebook.
- How popular is LSTMVis?
- HendrikStrobelt/LSTMVis has 1.3k stars on GitHub.
- Where can I find LSTMVis?
- HendrikStrobelt/LSTMVis is on GitHub at https://github.com/HendrikStrobelt/LSTMVis.