EthicalML/xai
Bias audits for ML, with bar charts instead of hand-waving
A Python toolkit that turns "trust me, it's fair" into reproducible plots you can show a regulator.
Not currently ranked — collecting fresh signals.
star history
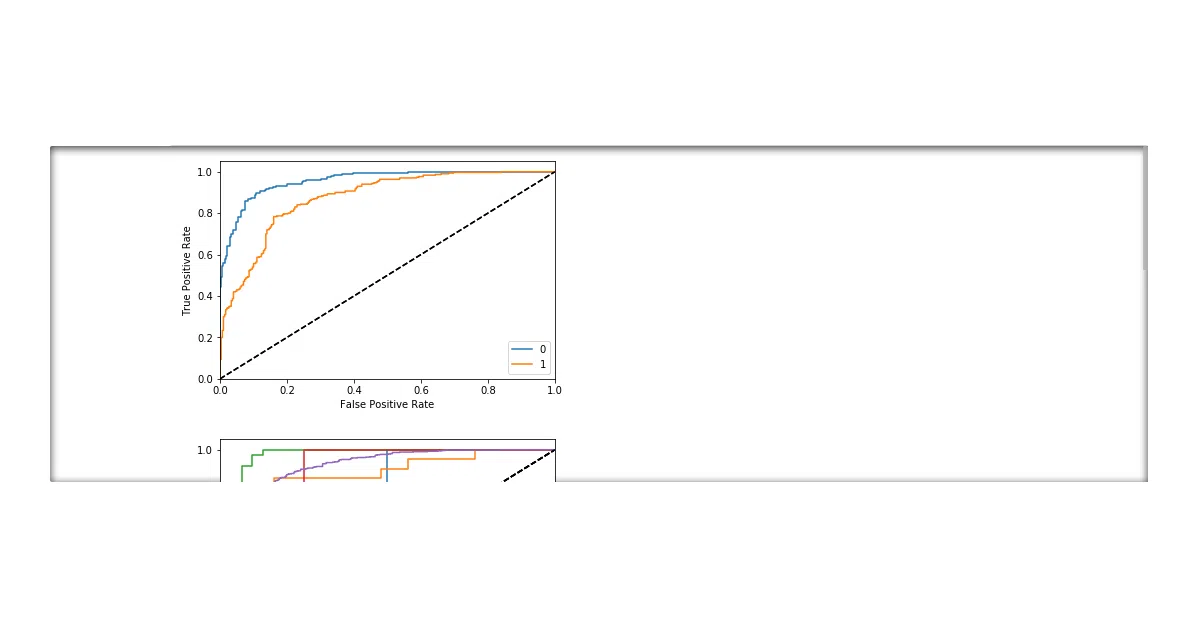
What it does XAI is a Python library for auditing machine-learning models and datasets for bias and imbalance. It wraps common fairness workflows—checking class distributions, rebalancing training splits, slicing ROC curves by protected attributes, and plotting permutation feature importance—into single function calls that return matplotlib figures.
The interesting bit The library treats explainability as a data-science workflow, not just a post-hoc algorithm. It structures work around three stages: data analysis, model evaluation, and production monitoring. The “smile imbalance” plots are a nice touch—they bucket predictions by confidence and overlay accuracy or manual-review thresholds so you can see exactly where your model gets cocky and wrong.
Key highlights
- Single-call plots for class imbalance, correlation matrices, and dendrograms
balanced_train_test_splitenforces minimum and maximum samples per cross-group (e.g., gender × loan outcome)- ROC and metric plots can be sliced by protected columns like gender, ethnicity, or age
- Permutation feature importance with a user-supplied scoring function
- Includes a built-in census dataset so the examples run out of the box
Caveats
- Version 0.0.5 ALPHA: explicitly tagged as early-stage
- Python support listed as 3.5–3.7, which is well past end-of-life; unclear if modern versions work
- The “production monitoring” step is mentioned in the principles but barely visible in the current API
Verdict Worth a look if you need to generate bias-audit visuals for compliance or stakeholder review. Skip it if you want deep causal fairness metrics or a battle-tested production framework—this is a plotting and data-surgery toolkit, not a full governance platform.
Frequently asked
- What is EthicalML/xai?
- A Python toolkit that turns "trust me, it's fair" into reproducible plots you can show a regulator.
- Is xai open source?
- Yes — EthicalML/xai is open source, released under the MIT license.
- What language is xai written in?
- EthicalML/xai is primarily written in Python.
- How popular is xai?
- EthicalML/xai has 1.3k stars on GitHub.
- Where can I find xai?
- EthicalML/xai is on GitHub at https://github.com/EthicalML/xai.