Egonex-AI/Understand-Anything · 17 Jun 2026 · Feature
An Atlas for Codebases Too Big to Read

Olivia Hartman
Editor
Understand Anything turns any repository into an interactive knowledge graph inside your existing AI coding assistant, because reading code blind is no longer a badge of honor.
Egonex-AI/Understand-Anything
★77k stars Velocity · 7d +139 ★/day ↘cooling
star history
The Onboarding Trauma That Built a Star
Every developer knows the Sunday-night dread of joining a new team and staring at a quarter-million lines of alien logic. The README might be a fiction, the architect has left for a startup, and the AI assistant at your side can answer questions about individual files but still reads code blind. It lacks the map. Understand Anything, an open-source plugin originally created by Lum1104 and now under the Egonex-AI organization, has ridden that exact pain to considerable visibility. The repository has accumulated tens of thousands of GitHub stars—one mirror lists roughly sixty-one thousand—and carries a Trendshift badge, suggesting that the timing was as important as the idea. Launched into a market suddenly crowded with Claude Code, Codex, Gemini CLI, and a dozen other agentic coding environments, the project hit a nerve. When AI assistants became the default interface, developers realized that an agent with no memory of the repository’s topology is only slightly better than grep with better syntax highlighting.
A Hybrid Brain for Structure and Intent
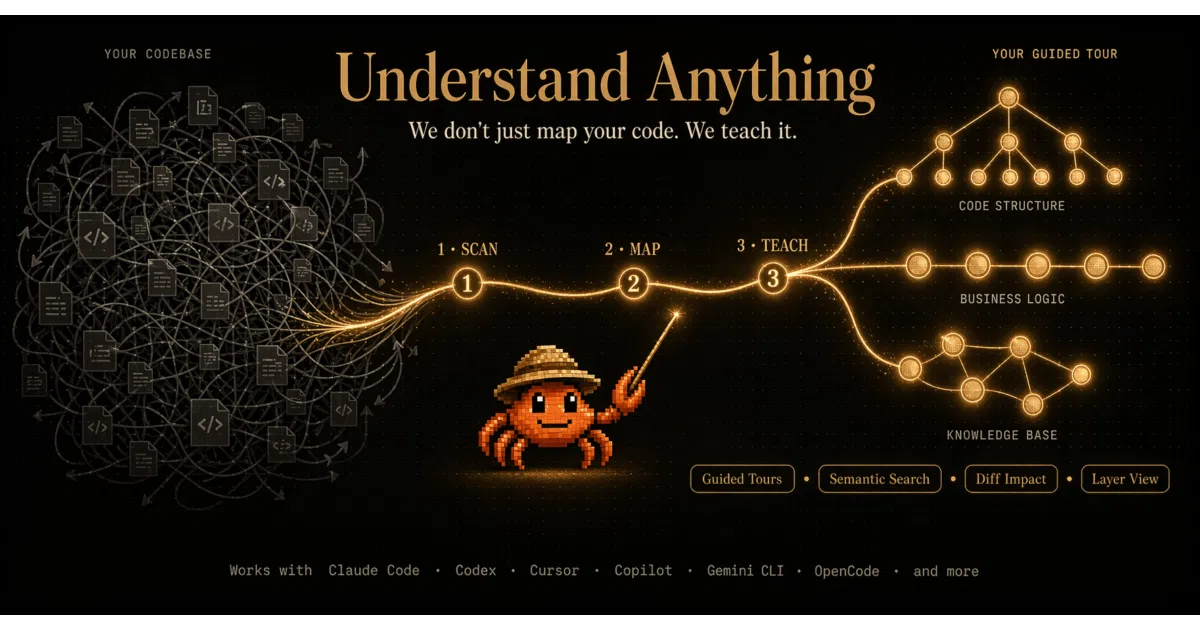
The project’s core technical bet is that a knowledge graph of code should not be built by an LLM alone. Large language models hallucinate edges, forget dependencies between distant files, and treat architecture as prose. They are excellent at intent but unreliable at structure. Understand Anything splits the work between deterministic parsing and statistical reasoning. Tree-sitter handles the concrete syntax tree, extracting imports, exports, function definitions, call sites, and inheritance into a reproducible import map. This structural layer is pre-resolved during the initial scan and passed downstream so that no agent has to re-derive mechanical facts from raw source. Because this phase is deterministic, the same codebase always yields the same skeleton.
Only after the structure is frozen do LLM agents annotate it with plain-English summaries, architectural layer tags, business-domain mappings, and guided tours. The result is a graph whose edges are reproducible and whose nodes carry semantic intent. This separation is why the tool can update incrementally. A fingerprint-based change detection system identifies modified files and re-analyzes only those, patching the graph rather than rebuilding it from scratch. File analyzers run in parallel batches. The pipeline is orchestrated by a half-dozen specialized agents: one discovers the project layout, another dissects individual files, a third assigns architectural layers such as API, Service, Data, and UI, a fourth constructs onboarding tours ordered by dependency, a fifth validates referential integrity, and a sixth extracts business domains and process flows. A seventh agent handles wiki-style knowledge bases, parsing wikilinks and categories deterministically from markdown indexes before surfacing implicit relationships. It is a small bureaucracy, but the division of labor keeps context windows focused and token costs predictable.
The wiki pipeline is a nice illustration of the tool’s broader ambition. It does not merely graph code; it graphs understanding. Point it at a Karpathy-pattern markdown wiki—an index file laced with wikilinks—and the deterministic parser extracts the explicit graph before LLM agents infer hidden connections between articles. The result is a force-directed knowledge graph with community clustering, turning a personal notes repository into a navigable web of ideas. This suggests the architecture was built to generalize beyond software, even if code remains the headline use case.
More Than a Hairball
Most code visualization tools produce what the project’s homepage candidly calls a hairball: a dense web of nodes and edges that proves the codebase is complex without teaching you anything. Understand Anything attempts to avoid this trap by offering a domain view that maps code onto business processes—authentication flows, payment pipelines, user lifecycles—rendered as horizontal graphs of domains, flows, and steps. It also surfaces diff impact analysis, showing which nodes in the graph are touched by uncommitted changes, and a persona-adaptive interface that adjusts detail levels for junior developers, product managers, or senior engineers. The search layer is hybrid as well, combining fuzzy name matching with semantic meaning queries so that a question like “which parts handle auth?” returns relevant nodes across the graph rather than a list of filenames.
Diff impact analysis deserves particular attention for teams. By overlaying uncommitted changes onto the existing graph, the tool visualizes ripple effects before a pull request is ever opened. A developer refactoring a utility function can see, in the graph, which service layers and API endpoints depend on it. The persona-adaptive UI then tailors that same view for a product manager interested in business flows or a junior engineer who needs a guided tour. These features turn the graph from a personal exploration tool into a shared coordinate system for the entire team.
The tool is not the only player attempting to graph code. Graph-Code, demonstrated by Vitali Avagyan and built on Memgraph, uses a similar Tree-sitter plus LLM stack but leans toward surgical code replacement and Cypher queries inside a standalone Dockerized application. Academic work has also validated the premise: a recent arXiv paper on knowledge-graph-based repository-level code generation showed that hybrid retrieval over code structures outperforms naive RAG on the EvoCodeBench dataset, confirming that inter-file dependencies matter for contextual accuracy. Understand Anything sits in the practical middle ground between research prototypes and heavy database-backed systems. It is lighter than a full GraphRAG deployment, yet more structured than asking a chatbot to summarize files one by one. Its value is integration: it lives inside the assistants developers already use rather than demanding a new environment.
The Graph as a Team Artifact
One of the more subtle shifts the project encourages is treating the knowledge graph as a versioned artifact rather than a transient report. The output is a JSON file that lives inside the repository. Commit it, and new teammates skip the analysis pipeline entirely, loading a pre-built graph into their local dashboard. The project maintains a fork of Google’s microservices-demo reference application with a committed graph exactly to prove the point. For large monorepos where the graph exceeds ten megabytes, the documentation nudges teams toward git-lfs. Auto-update hooks can incrementally patch the graph on every commit, keeping the map and the territory in sync.
This model turns onboarding documentation from a static wiki page into an interactive, explorable object. It also means the graph is portable across the fourteen-plus AI platforms the plugin supports. It runs natively inside Claude Code, auto-discovers itself in Cursor and VS Code Copilot through manifest files, and extends to Codex, Gemini CLI, Trae, and others through cross-platform installers that wire the plugin into the host environment without manual configuration. Because the heavy lifting happens locally, the graph remains the team’s property. The tool also localizes its output, generating node descriptions and dashboard labels in Chinese, Japanese, Korean, Russian, Spanish, or Turkish, which suggests the maintainers see adoption happening outside the English-speaking open-source core.
Where the Map Ends
For all its polish, the project is candid about what it does not do. It is a cartography tool, not a code generator. It will not write your functions for you, and its semantic summaries are only as good as the LLM producing them. The default graph reviewer runs inline for speed; a deeper, full-LLM review requires an explicit flag, which suggests a trade-off between thoroughness and token cost. The business-domain extraction, while conceptually compelling, depends on the LLM’s ability to infer intent from structure—an exercise that can misfire on heavily abstracted or generic code. And because the tool is fundamentally a plugin layer, its fate is tied to the platforms it rides. If Claude Code or Cursor decide to build native knowledge graphs, the value proposition could narrow.
Yet the field is moving quickly in the other direction too. Cursor and Claude Code are improving their native repository understanding, but they still rely on repeated file reads to recover cross-file relationships. Standalone tools like Graph-Code offer deeper database-backed querying but require a separate stack. Understand Anything’s bet is that developers would rather have a lightweight, shareable graph layer inside the assistant they already use than migrate to a monolithic new environment. The latest commits add support for additional platforms such as Kiro, and the rapid accumulation of stars suggests the bet is paying off. If the project succeeds, the very idea of “reading the codebase” may become as quaint as reading raw assembly. Developers will navigate it, query it, and tour it. The graph will not replace the code, but for the engineer facing those two hundred thousand lines on day one, it might finally replace the panic.
Sources
- Understand Anything — Graphs that teach the codebase
- robert-mcdermott/ai-knowledge-graph: AI Powered ... - GitHub
- Interactive graph visualization (without paid software)? : r/semanticweb
- Egonex-AI/Understand-Anything at geeek.org - GitHub
- Knowledge Graph Based Repository-Level Code Generation - arXiv
- 15 best graph visualization tools for your Neo4j graph database
- This AI Tool Maps Any Codebase Before You Touch It (Understand ...
- Has anyone actually built a production-ready code-to-knowledge ...
- Knowledge Graph Visualization: Practical Insights, Uses - FalkorDB
- Turn Any Codebase Into an Interactive Knowledge Graph
- GraphRAG for Devs: Graph-Code Demo Overview - Memgraph
- From Unstructured Text to Interactive Knowledge Graphs Using LLMs